A busbar can be electrically perfect at the factory and fail quietly five years later, and the cause is almost always thermal cycling. Every load cycle heats the copper, every shutdown cools it, and the expansion mismatch between copper, dielectric and hardware slowly fatigues the weakest interface — a solder fillet, a bolt joint, a laminate edge. The power electronics industry has spent decades documenting this in IGBT modules: CTE mismatch drives solder fatigue, cracks start beneath the chip — the hottest spot — and forward-voltage drift is the measurable warning. This guide translates those reliability lessons to laminated busbar assemblies and gives the design and test playbook for long service life.
A busbar can be electrically perfect at the factory and fail quietly five years later, and the cause is almost always thermal cycling. Every load cycle heats the copper, every shutdown cools it, and the expansion mismatch between copper, dielectric and hardware slowly fatigues the weakest interface — a solder fillet, a bolt joint, a laminate edge. The power electronics industry has spent decades documenting this in IGBT modules: CTE mismatch drives solder fatigue, cracks start beneath the chip — the hottest spot — and forward-voltage drift is the measurable warning. This guide translates those reliability lessons to laminated busbar assemblies and gives the design and test playbook for long service life.
The two tests stress different parts of the assembly. Thermal cycling changes the whole module or assembly temperature between set points (for example -40°C to +125°C per IEC 60068-2-14), and it stresses the package level: baseplate warpage, substrate solder delamination, mould compound cracking, and overall thermal resistance increase. Power cycling instead heats only the active devices by self-heating — fast, localised thermal shocks — and it stresses the chip-level interfaces: die attach and wire bonds. In a busbar assembly the equivalent distinction is between ambient-cycling tests (whole assembly, laminates, hardware) and load-cycling tests (current-driven heating of the conductor and joints).
For a power electronics busbar, both matter: the laminate sees ambient cycling in outdoor enclosures, while the joints see load cycling every time the converter runs. The vibration and bolted joint guide covers the mechanical side; this guide covers the thermal side of the same reliability story.
Every material in a busbar assembly expands differently with temperature. Copper expands about 17 ppm/K, aluminium ~23 ppm/K, PET film and epoxy dielectrics an order of magnitude more in-plane or through-thickness depending on construction, and steel hardware about 12 ppm/K. When the assembly heats, each layer wants to grow a different amount, and the interfaces bear the difference as shear stress. Over thousands of cycles, that stress accumulates as creep, voids, cracks and delamination in the solder and adhesive layers.
The IEEE literature on IGBT module solder fatigue is explicit about the mechanism: because of different CTE for adjacent layers in the multilayered module, excessive thermomechanical stress presents in the solder layer, and solder fatigue accumulates between the base plate and the DCB substrate in the form of creep, voids, cracks or delamination. The busbar version of the same physics is the solder or adhesive bond between copper layers and dielectric, and between terminal lugs and conductor.
Fatigue is a local phenomenon, and it starts where the temperature is highest. In an IGBT module that is the solder directly beneath the chip centre — the heat flows down through the chip into the solder, and the hottest, most stressed zone cracks first. In a busbar assembly the equivalent hot spots are the terminal joints (where current density concentrates), the interfaces beside heat sources (module terminals, resistor banks), and the laminate regions over busbar cross-over points where loss density peaks.
The design consequence is that reliability is decided at the hot spots, not by the average temperature. A thermal simulation that reports only a 40°C average is hiding the 95°C terminal interface where the crack will start. Our thermal management design guide shows how to identify the hot spots with simulation before the first prototype, and how to cool the interfaces that will otherwise fatigue first.
Soldered busbar connections — terminal lugs, laminated layer bonds, busbar-to-terminal joints — are the classic fatigue site. Lead-free solders behave differently from traditional tin-lead ones: they are stiffer and creep differently, and thermal resistance degradation as the solder cracks often follows a different curve. The failure sequence is consistent: micro-cracks appear at the interface edge, grow under cycling, increase the local thermal resistance, raise the joint temperature, and accelerate the next cycle — a positive feedback loop that ends in an open or a hot joint.
The test evidence comes from power cycling studies of IGBT modules, where on-state collector-emitter voltage (V_CE_ON) and forward voltage (V_F) drift are the standard condition-monitoring indicators of solder degradation. The busbar equivalent is contact-resistance drift at bolted joints and thermal-impedance rise at soldered interfaces. Monitoring both turns a failure into a scheduled repair.
In IGBT modules, bond wire lift-off and heel cracking are the other dominant wear-out mode — the wire fatigues at the bond heel where the aluminium transitions from the wire to the bond pad. The busbar analogues are welded joints (ultrasonic, laser or TIG) and the welded lugs on battery busbars. Welds concentrate stress at the weld toe; under thermal cycling, cracks initiate there and grow across the weld zone. The welding and joining guide discusses joint design; the reliability message is that weld geometry — not just weld strength — decides cycling life.
The design countermeasures are the same ones that protect bond wires: keep the cycled temperature range small (cool the interface), locate the joint away from the highest temperature gradient, and choose joint geometries with generous fillet radii so the stress spreads instead of concentrating.
Bolted busbar connections relax under thermal cycling even when the torque was perfect at installation. The mechanism is creep: copper pads soften and flow slightly at elevated temperature, the clamp force drops, contact resistance rises, the joint runs hotter, and the next cycle relaxes it further. In vibration environments the two mechanisms combine — thermal relaxation plus mechanical loosening — which is why vibration-rated joint design and thermal design share the same joint review.
The practical fixes: spring washers or Belleville washers that maintain force as the copper creeps; re-torque procedures after the first thermal season; plated contact surfaces that keep the interface oxide-free; and torque documentation that lets maintenance know what the joint should be. A bolted joint is a maintenance item, not a fit-and-forget detail — the reliability plan should say when it gets re-checked.
The laminated construction itself cycles: copper layers expand against the dielectric, and over thousands of cycles the bond at the laminate edges can micro-delaminate. The danger is not structural — it is electrical: a delaminated edge becomes a cavity, and a cavity in a high-voltage laminate is a partial-discharge site. The PD inception voltage drops as the void grows, and the failure appears as leakage or discharge years after installation. This is why edge sealing and void-free lamination are reliability features, not cosmetic ones.
For multi-layer laminated busbar construction, the laminate quality shows in the thermal-cycling test: after 1,000 cycles, a good laminate shows no PD inception change, while a marginal one shows measurable drift. Our PD-free design guide covers the void-and-edge physics, and the insulation testing guide covers the measurements that catch the drift.
The reliability test menu for busbar assemblies follows the standards the power electronics industry already uses. Temperature cycling per IEC 60068-2-14 with defined ramp rates, dwell times and cycle counts; power cycling per the methodology reviewed in the IEEE literature, with junction or joint temperature swing as the control variable; humidity cycling (IEC 60068-2-30 or IEC 60068-2-38) where outdoor duty applies; and vibration per IEC 60068-2-6/2-64 for transport and operating environments. The test plan should state the failure criterion — how much contact resistance drift, or what PD inception change, constitutes failure — before the first cycle runs.
The IEEE power cycling review notes that power cycling tests predict component lifetime in power converters, and that the measurement circuits for V_CE_ON and V_F are the standard condition-monitoring route during the test. The same logic applies to a busbar programme: define the indicator, measure it through the test, and publish the curve with the datasheet.
Five design rules dominate thermal-cycling reliability. First, minimise the cycled temperature range at the interfaces — every 10°C reduction roughly doubles fatigue life for many materials, so cooling the joint is a reliability measure, not just a derating convenience. Second, match coefficients where possible: aluminium connections on aluminium busbars, copper on copper, and hardware selected to sit between the CTEs of the parts it clamps. Third, spread the stress: generous fillet radii, larger contact areas, distributed bolting. Fourth, protect the interface: plating that stays oxide-free, sealing that keeps moisture out of the joint. Fifth, design the inspection in: accessible joints, documented torque, and a monitoring point where resistance or temperature can be measured in service.
Our DFM checklist includes the reliability-related items, and the design guide covers the layout rules — the two documents together give the drawing-level version of this article.
Buyers of busbars for cycling-heavy applications — EV traction, storage containers, industrial drives, wind nacelles — should put reliability evidence in the RFQ: the thermal-cycling test plan, the cycle count target, the failure criteria, and the monitoring indicators. A supplier who can show 1,000-cycle test data with stable contact resistance is making a different offer from one who quotes only the static rating. The supplier evaluation guide scores this evidence alongside price and lead time.
For EV and automotive programmes the requirement is usually already there through AEC-style qualification expectations; for industrial and storage applications the discipline is catching up. The buyers who add it now are the ones who avoid the warranty year.
The most reliable indicator of a fatiguing busbar joint is drift: contact resistance rising, joint temperature rising relative to baseline, or PD inception falling on a high-voltage laminate. All three are measurable in service with the right design hooks — a sensing pad on the busbar, an accessible joint, a PD measurement point. The quality programme behind a busbar order should include the monitoring guidance, not just the test certificate.
In practice, infrared scanning at commissioning and at each annual service catches the hot joints early; resistance measurement catches them earlier but requires access. The combination — commissioning scan, annual scan, and torque re-check after the first thermal season — is the cheap version of condition monitoring that catches 90% of cycling failures before they become failures.
Thermal cycling in a busbar is driven by two heat sources: the ambient cycle and the load cycle. The load cycle is the one the designer controls, and it is governed by current density. At a terminal joint, the current crowds into the contact area; the resulting loss heats the joint; the temperature rise increases the contact resistance (copper resistivity rises with temperature); and the hotter joint dissipates more loss — a feedback loop that runs hotter than the surrounding bar. A joint sized for 30°C rise at the bar average can run 60°C at the contact, which is exactly the temperature swing that fatigues the interface.
The ampacity and current sharing resources cover the rating side; the reliability side is the same calculation looked at from the interface. If the contact area is too small, no plating or torque will save the joint from cycling fatigue.
A recurring field pattern in energy storage racks illustrates the mechanism. Rack busbars rated for 30°C rise at 25°C ambient run fine through the first year; in the second year, a few bolted terminals show elevated temperature at the annual scan; by the third year, those terminals are re-torqued and some lugs are replaced. The root cause is the container's daily cycle: charge by day heats the bus to 55-65°C, the night shutdown cools it to 20°C, and the 40°C swing repeats daily — about 1,400 cycles by the end of year two, which is enough to relax a marginally-torqued M8 joint.
The fix is the combination this guide recommends: larger contact area, spring washers to hold clamp force, re-torque at the one-year service, and a commissioning baseline so the drift is visible. The storage DC-link article covers the electrical side; the reliability lesson is that the daily cycle is a test that runs whether or not the product was qualified for it.
Aluminium presents a special CTE case: it expands about 23 ppm/K against copper's 17 ppm/K and steel's 12 ppm/K, and its oxide film reforms at every disturbed interface. An aluminium-to-copper joint under thermal cycling sees differential expansion plus the oxide problem, and the interface fatigues faster than a like-metal joint. Where aluminium appears on non-critical paths or where weight matters, the design should manage the mismatch: bimetallic transition pieces, spring-loaded connections, larger contact areas, and plating that inhibits re-oxidation.
Our copper vs aluminium resource covers the conductor-level trade; the reliability rule is that every dissimilar-metal interface is a maintenance item with a defined inspection interval. The plating choice — nickel barriers, tin finishes — is part of the CTE and corrosion management at the same joint.
Component-level tests prove the part; system-level conditions decide the real duty. A busbar may pass 1,000 cycles at 60°C swing on the bench and still fail in a container where the swing is 45°C but the vibration is present, or where the ambient humidity accelerates the interface degradation. The reliability qualification should therefore combine the thermal test with the actual system conditions: the enclosure's thermal profile, the mounting vibration, and the service schedule. The vibration and outdoor humidity guides cover the other two legs of the same qualification triangle.
For buyers, the ask is a combined test plan rather than three separate certificates: thermal cycling on the assembly as mounted, with humidity where outdoor duty applies, and vibration where the application demands it. The parts pass individually and fail together is the most common qualification gap in the industry.
Reliability is ultimately a calendar question: how many years of service does the assembly survive? The engineering shortcut is the Coffin-Manson relationship — fatigue life scales with the temperature swing to a power, typically around minus 2 to minus 3 for solder. That makes the swing the dominant variable: reducing a 60°C swing to 45°C can roughly double or triple the life, and reducing it to 30°C can multiply it several times over. The same physics that makes the 10°C rule useful also makes the cooling investment easy to justify.
For a custom busbar programme, the life estimate should be stated with the swing assumption: 'designed for 5,000 cycles at 50°C swing' is a testable statement, while 'designed for 20 years' is a hope without a duty cycle. Our short-circuit and thermal documents together define the full mechanical duty that the life estimate covers.
The reliability file that travels with a busbar order should contain: the test plan, the cycle counts and failure criteria, the monitoring indicators (contact resistance, temperature, PD inception), the life estimate with the swing assumption, and the service recommendations — re-torque interval, inspection points, replacement criteria. Buyers who receive this file can put the busbar on a maintenance schedule instead of discovering the fatigue in the field.
Our quality page describes the test and document control behind the file, and the factory tour shows the cycling test equipment. The discipline is simple: state the duty, test the duty, and publish what was tested. That is the entire reliability contract between a busbar supplier and a converter builder.
How many cycles should a busbar survive? It depends on the application — industrial drives typically specify hundreds to thousands of cycles; automotive and grid-tied storage may require thousands with defined failure criteria. Are bolted joints or welded joints better under cycling? Welded joints have no relaxation but concentrate stress at the weld toe; bolted joints can be re-torqued but relax under creep. The right answer depends on the temperature swing and the maintenance plan. How do I know my busbar is fatiguing? Measure contact resistance or joint temperature drift against the commissioning baseline. Can the design fix cycling issues? Usually yes — cooling the interface and spreading the stress are the two highest-leverage changes. Contact our engineering team for a reliability review of your layout.
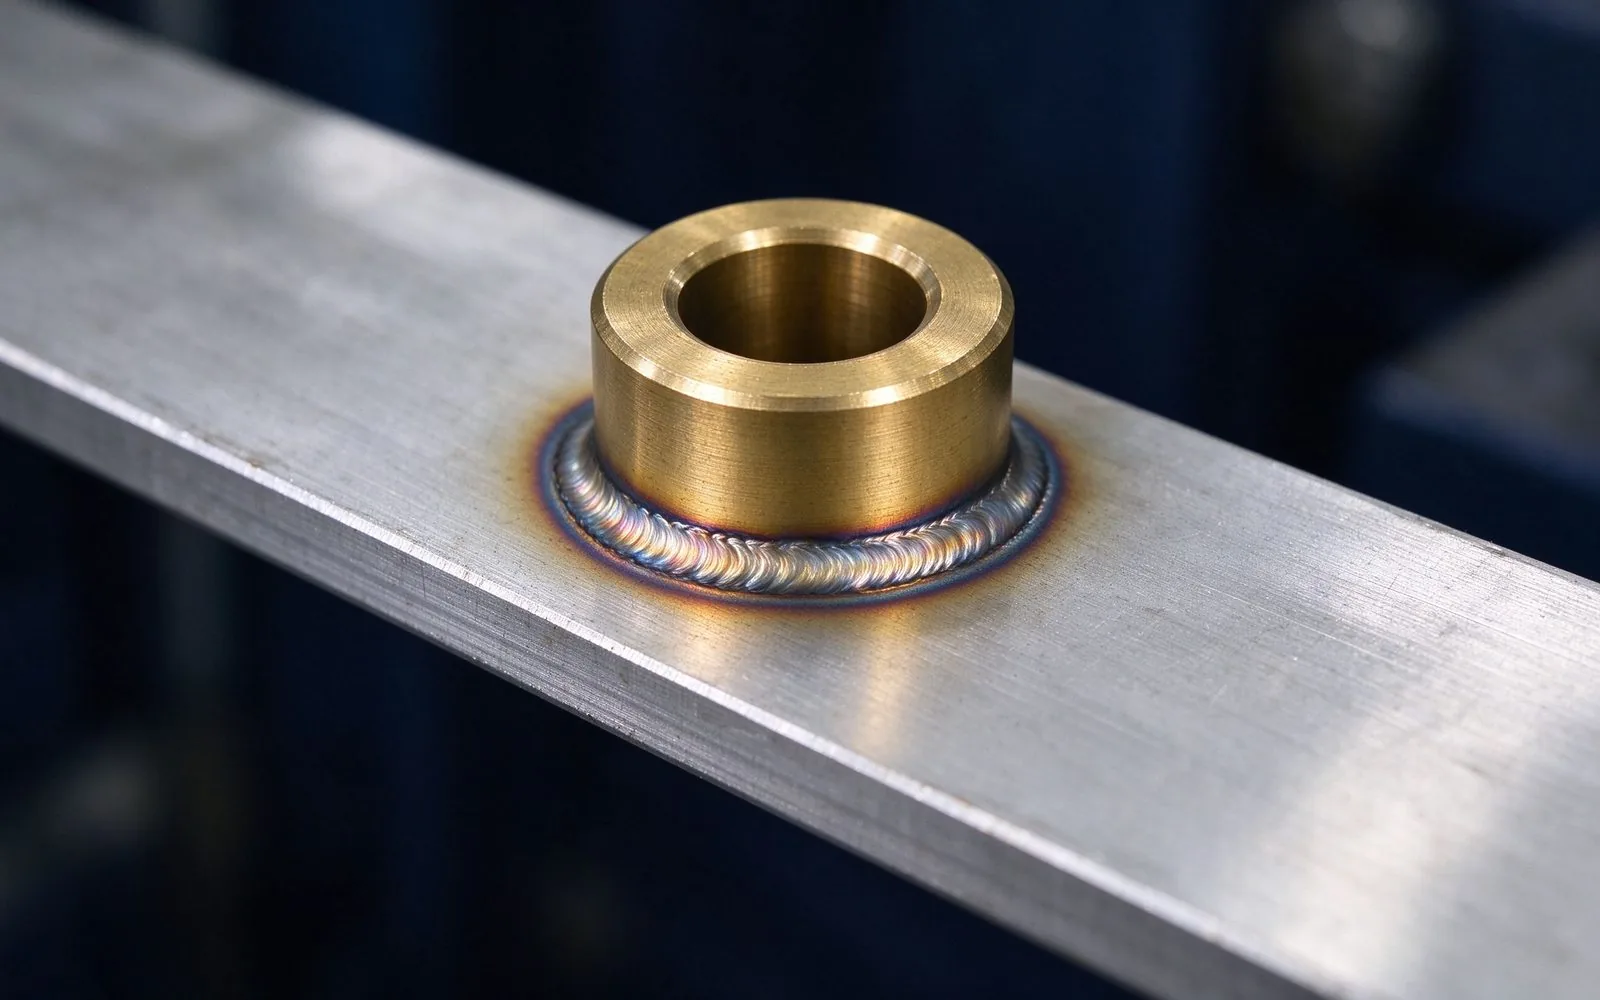
A busbar connection is only as good as its joint. Ultrasonic welds reach 0.005-0.169 mOhm
Read article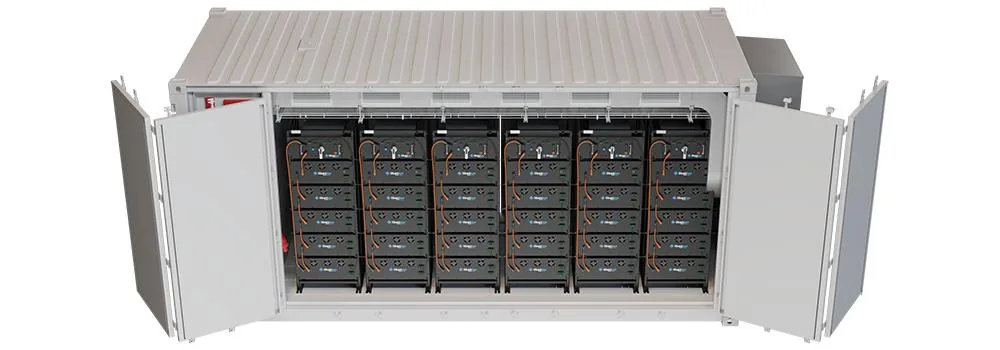
A bolted busbar joint fails in one of two ways: vibration loosens it or thermal cycling fa
Read article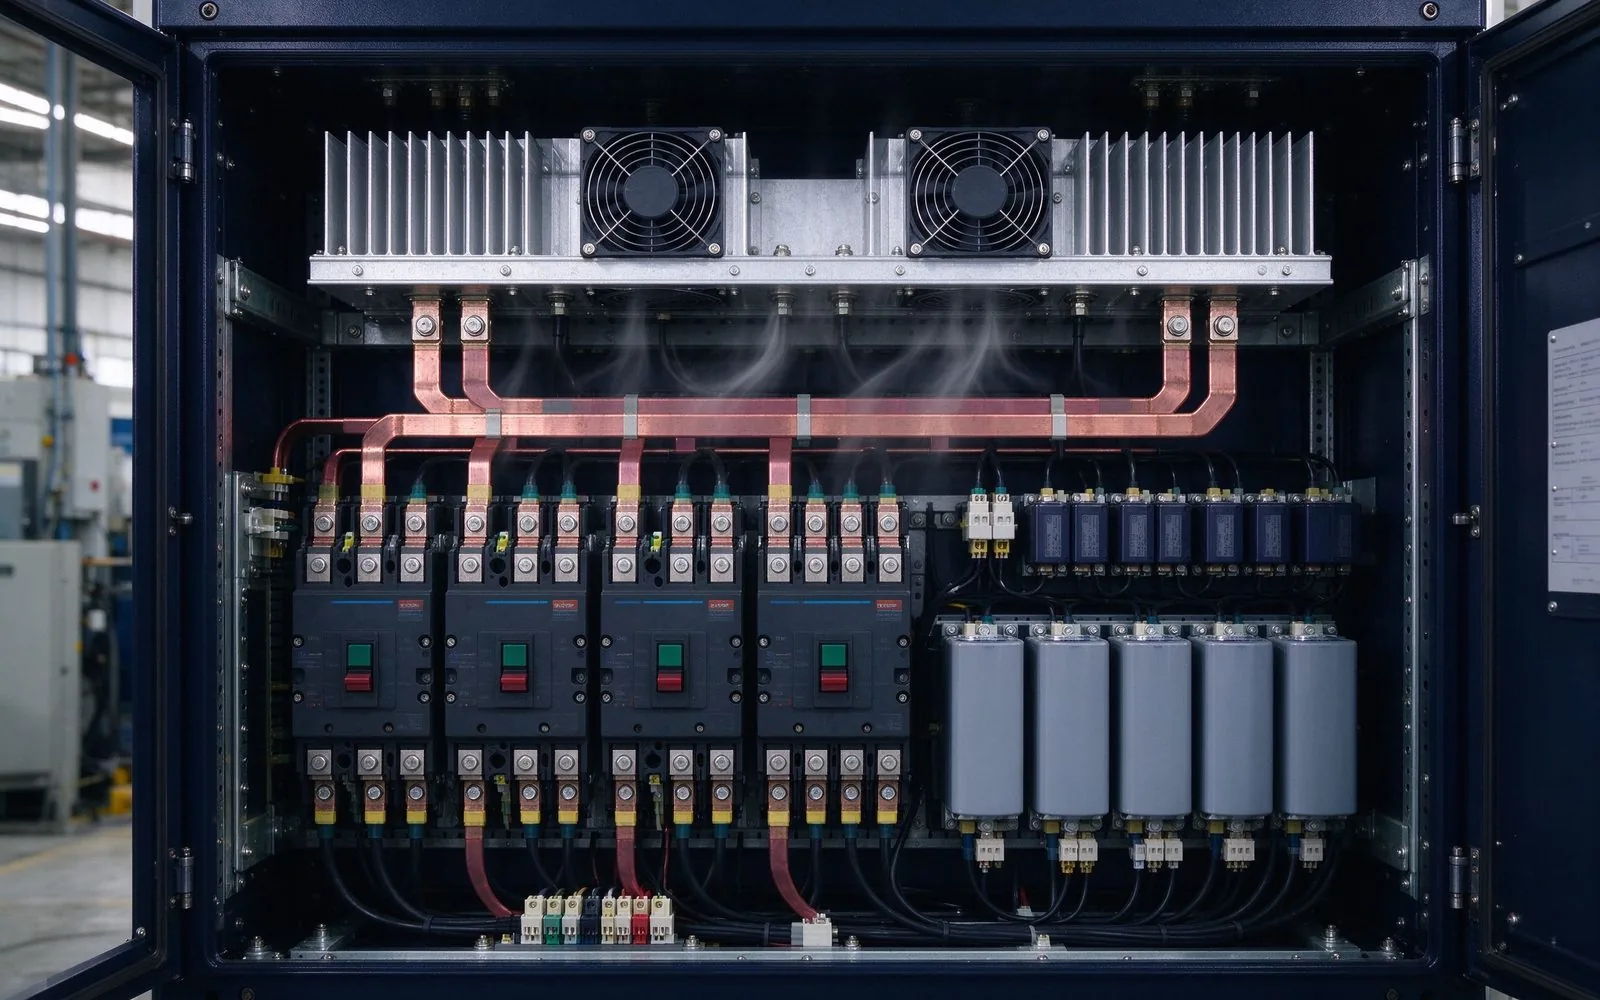
A busbar's thermal design decides its real current rating. Natural convection sheds ~50 W/
Read article
Nadia Rahman is a quality and compliance engineer with 9 years in electrical-component quality systems. She manages SHANYUAN's ISO 9001 and IATF 16949 programmes, incoming and outgoing inspection, and UL/IEC compliance documentation. She holds a B.Sc. in Industrial Engineering from the Universi
Send the current profile, voltage class and terminal types — our engineers reply within one business day.