Every amp a busbar carries is bought with temperature. The I2R loss in the conductor raises its temperature; the environment decides how fast that heat leaves; and the insulation's thermal class decides how much temperature the stack can tolerate. Understanding those three links - loss, cooling, limit - is what turns a busbar rating from a guess into an engineering calculation. This guide covers the heat paths, the cooling options from free air to liquid, and the derating discipline that keeps a 30 C-rise design honest in the field.
Every amp a busbar carries is bought with temperature. The I2R loss in the conductor raises its temperature; the environment decides how fast that heat leaves; and the insulation's thermal class decides how much temperature the stack can tolerate. Understanding those three links - loss, cooling, limit - is what turns a busbar rating from a guess into an engineering calculation. This guide covers the heat paths, the cooling options from free air to liquid, and the derating discipline that keeps a 30 C-rise design honest in the field.
A busbar's steady-state temperature is where the generated heat meets the removed heat. Generation is I²R: resistive loss in the copper (including the AC/skin-effect penalty where ripple is present) plus contact losses at every joint. Removal is by three paths - conduction through the busbar itself and its mounting, convection from the surfaces, and radiation. In free air, a single flat bar loses roughly 50 W per square decimetre of surface by natural convection; adding a heat sink with forced air raises that capability, and liquid cooling jumps the budget to the kilowatt-per-square-decimetre range - figures cited in laminated busbar thermal literature.
The rating consequence is direct: a busbar's current capacity is not a material property, it is the current at which the generated heat equals the removed heat at an acceptable temperature. That is why the same cross-section can be rated 100 A free-hanging and 300 A bolted to a cold plate - and why ampacity tables always state the cooling assumption.
Copper's thermal conductivity (about 385-400 W/(m·K)) makes the busbar one of the best heat spreaders in any power assembly. In a power module, the busbar often is the only continuous metal path between the switching devices and the cooling surface, so its conduction path matters as much as its electrical path. Three details dominate: conductor thickness (thicker copper spreads heat laterally and lowers temperature), the interface to the cold plate (machined surfaces, low thermal-resistance thermal interface material, and adequate clamping pressure), and the dielectric between layers (thin, thermally conductive dielectrics pass heat to the next conductor, while thick film wraps add resistance).
For stack-up design, the trade-off is explicit: a thick dielectric improves voltage withstand but blocks the vertical heat path; a thin dielectric passes heat but must still meet creepage and PD requirements. The engineering answer, reflected in SHANYUAN's multi-layer insulated busbar family, is to size the dielectric for the voltage class and let the copper carry the heat horizontally to the edge or the cold plate.
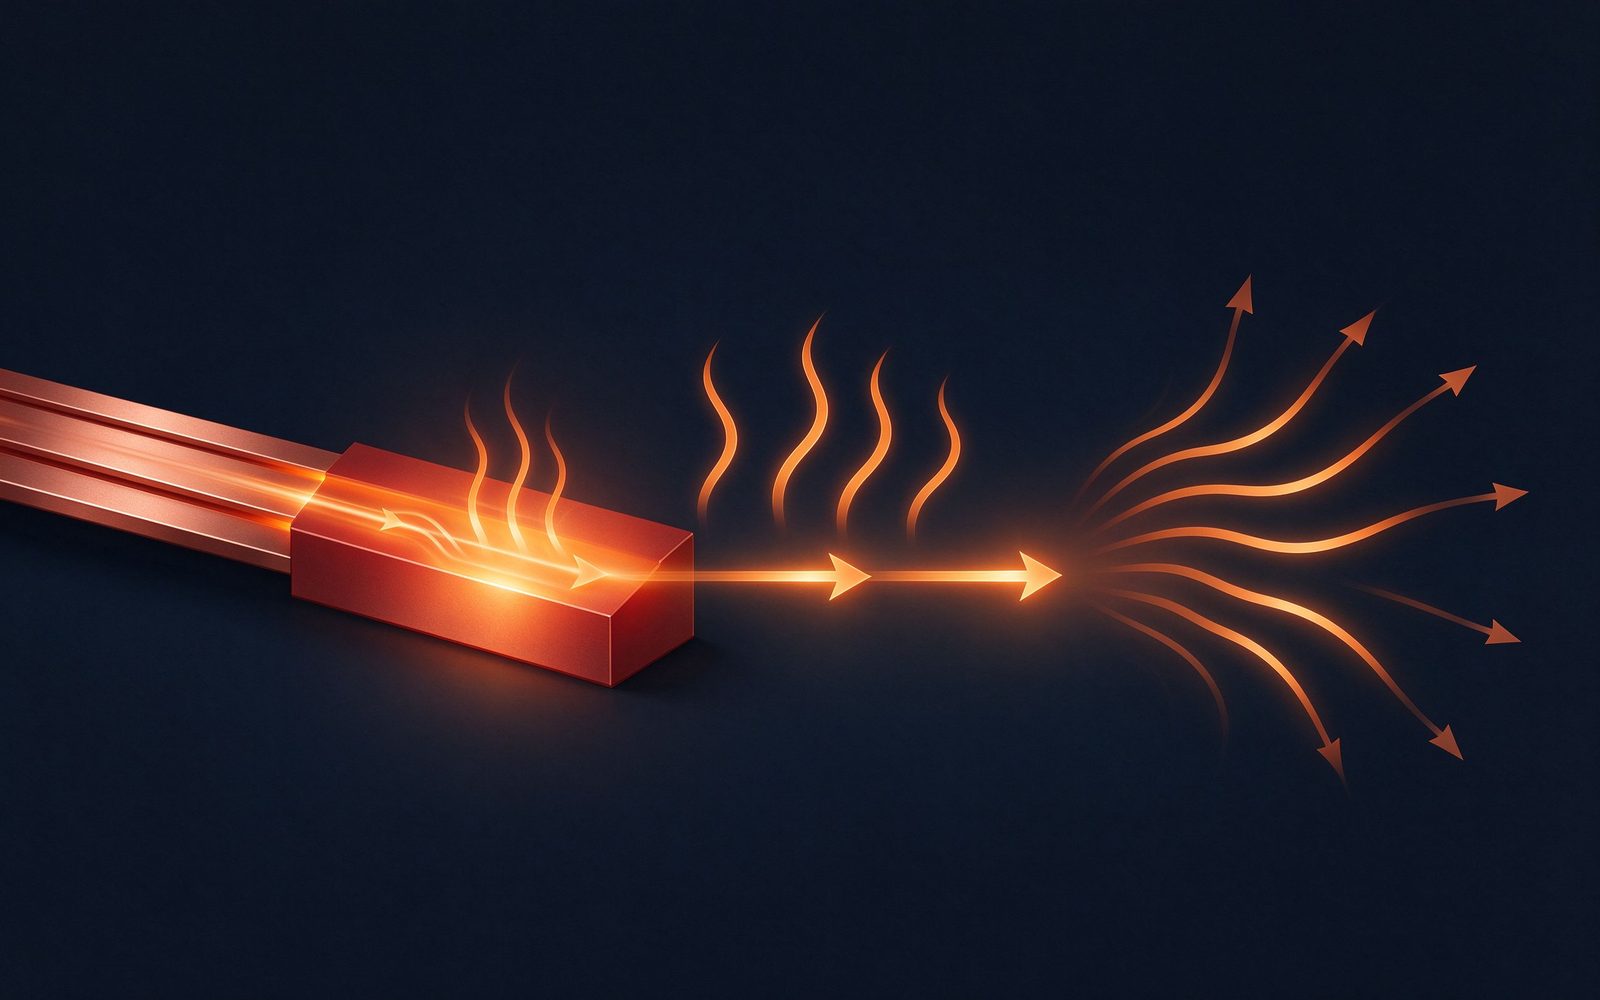
Natural convection plus radiation is the default cooling mode for busbars in open cabinets. The loss density is modest - on the order of 50 W/dm² for natural convection with a heat sink, rising several-fold with forced air - which means a 500 A busbar in free air needs a large surface area or an aggressive derate. The practical levers are: orient the busbar to maximise vertical convection, keep spacing between stacked bars (bundling derates current), add fins or a heat sink to the flat face, and apply forced airflow along the conductor axis.
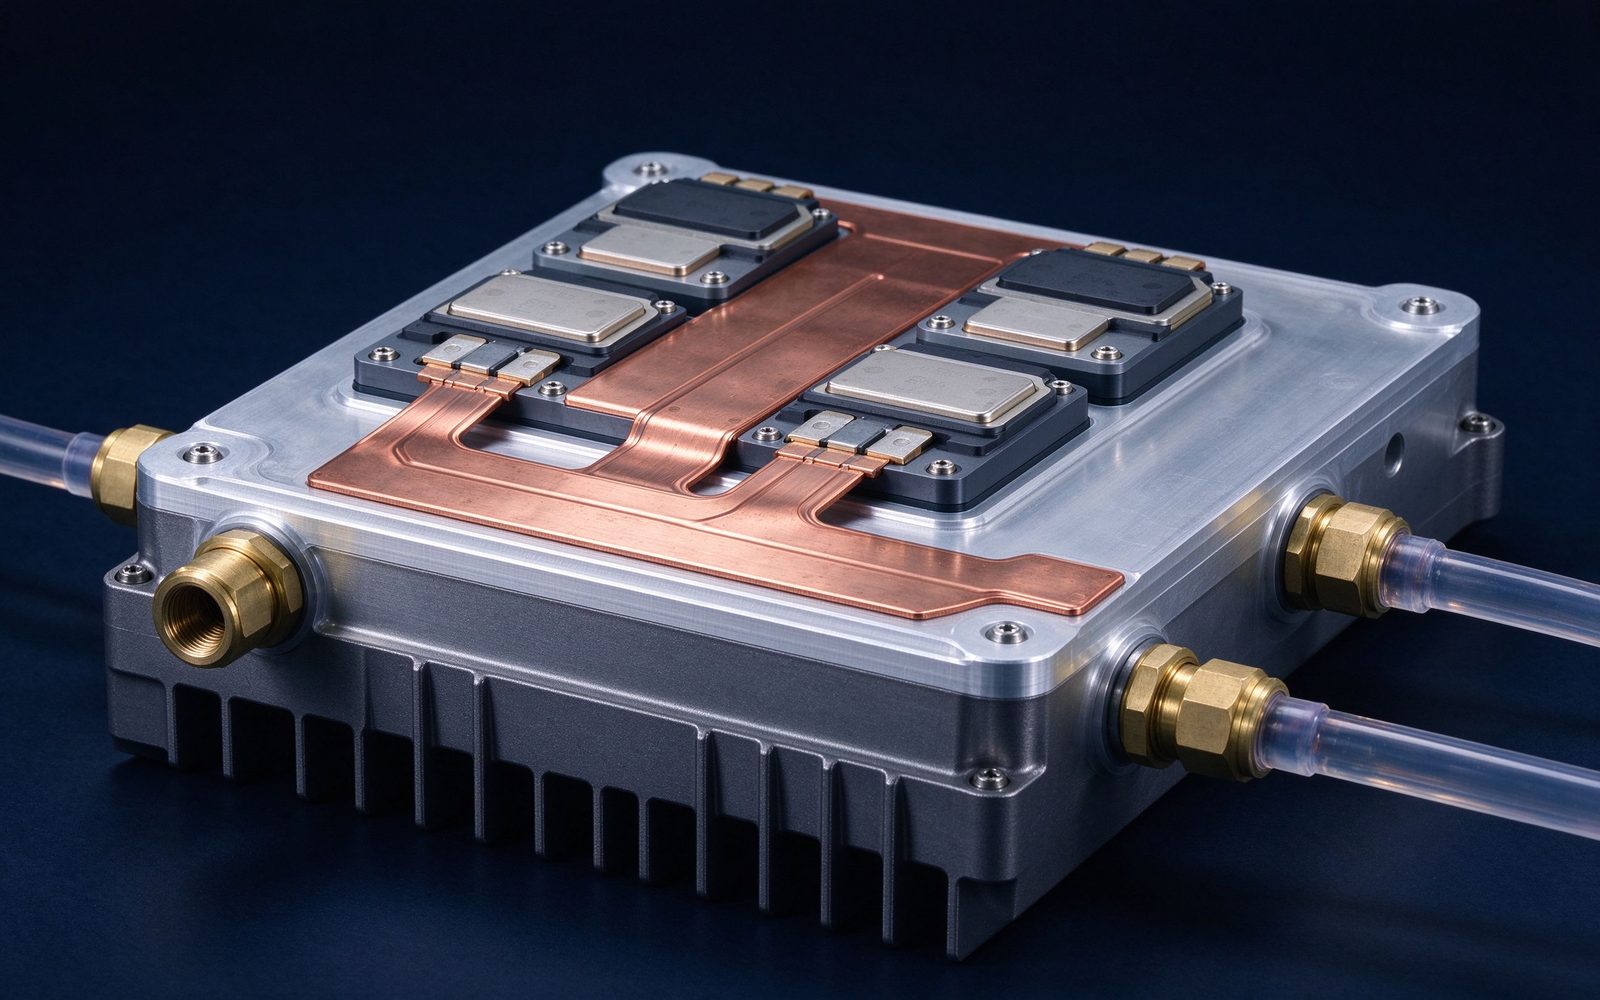
Forced air is where most industrial and traction cabinets live. A heat sink with forced air raises the heat removal capability to roughly ten times natural convection, which is why inverter and PCS designers almost always pair the DC-link busbar with a finned heat sink or cold-plate mount. The derating rule of thumb used across the industry is 1-2% reduction in current rating for every degree Celsius above a 35-40 °C ambient - the same logic formalised in the thermal management guidance.
When loss density exceeds what air can move, the design moves to liquid. Published data on water-cooled laminated busbars shows the scale of the benefit: with 15 °C water, a 3 mm busbar's temperature drops about 23 °C and a 0.8 mm conductor's temperature drops about 58.5 °C compared with the uncooled case. Junction-box studies report heat transfer coefficients around 12,000 W/(m²·K) with a 50:50 water-glycol mix at 8 L/min and 0.3 MPa, cutting busbar hotspot rise by roughly 45 °C under a 300 A continuous load. At the top end, multi-channel liquid-cooled busbars announced in 2026 demonstrate 15 °C temperature rise at 15,000 A.
The design implications are specific: the busbar needs internal channels or an integrated cold-plate interface; the coolant loop (pump, reservoir, radiator) is a system, not a component; and every dielectric surface near the coolant must tolerate humidity and condensation. Liquid cooling is not a rating upgrade, it is a thermal architecture change - which is why charging, traction and high-power storage designs are adopting it now.
The industry's reference rating method for busbars is a 30 °C temperature rise above a 40 °C ambient, in free air, horizontal, single bar - the baseline SHANYUAN uses and publishes. From that baseline, derating factors apply for every deviation: ambient temperature (1-2% per °C above 35-40 °C), bundling and enclosure, altitude (reduced air density), and duty cycle. The derating is multiplicative, and a fully derated part can carry half its free-air rating in a hot, enclosed cabinet.
The reason to insist on the method is comparability. Two suppliers quoting the same busbar at different rating assumptions are quoting different products. When evaluating high-current battery module busbars or any DC-link part, ask for the rating method and the derating factors used - the ampacity chart makes the comparison possible.
For conventional air-cooled busbars, practical current densities sit in the 2-5 A/mm² range depending on cooling; above roughly 10 A/mm², air cooling stops being sufficient and the design must move to liquid-cooled or hollow-channel conductors. The transition is not a hard number - it depends on geometry, ambient and acceptable rise - but it is a useful design gate: if the calculation lands above 10 A/mm², plan for active cooling as part of the architecture rather than an afterthought.
Hollow busbars with internal coolant channels are the classic solution for extreme current densities, and laminated variants of the same concept are emerging for DC links where flat geometry matters. For most traction and storage applications, however, the answer is a solid laminated busbar mounted to a cold plate - the configuration that custom busbar design reviews typically evaluate first.
Temperature is not just a rating limit; it is a cycling stress. Every power cycle expands and contracts the copper, the dielectric and the bolted joints at different rates, and thermal cycling is the classic killer of bolted busbar connections - joints loosen, contact resistance rises, and the hotspot migrates until failure. The design responses are: adequate terminal torque with spring washers, plating that resists oxidation under temperature (tin is standard), dielectric materials with compatible coefficients of thermal expansion, and mechanical compliance in long bars.
Qualification practice follows the same logic: thermal cycling tests (-40 to +105 °C or application-specific ranges) with periodic resistance and IR measurements catch joint degradation before it reaches the field. The test evidence is part of the quality system documentation SHANYUAN provides with series orders.
In a real assembly, the busbar is not the only heat source: capacitors, fuses, terminals and the devices themselves all add heat locally. Hotspot management means checking the worst-case location - usually a terminal under a neighbouring heat source - rather than the average busbar temperature. Thermal simulation of the assembly (finite-element conduction plus CFD where airflow matters) is now standard practice in design reviews, and it is where DFM checklists meet thermal engineering.
For a buyer, the practical ask is simple: request the thermal report - not the marketing curve - for the actual assembly conditions. It should state the ambient, the cooling interface, the loss inputs and the resulting hotspot rise. That document is worth more than any single test value.
Modern busbar design reviews simulate before building. A finite-element thermal model starts with the geometry, material properties (copper thermal conductivity, dielectric conductivities) and loss inputs (I²R by section, contact losses at terminals), then solves the steady-state temperature field for the specified cooling boundary - free air, forced air with a heat sink, or a cold plate with a defined coolant temperature and flow. The output that matters is the hotspot temperature at the worst-case terminal, not the average conductor temperature.
The simulation discipline catches three classic errors: terminals under neighbouring heat sources (a fuse or capacitor dumping heat into the busbar), dielectric layers blocking the vertical heat path, and long conductor runs whose far end runs hot because conduction is the only path out. When the model and the physical test diverge, the usual culprits are contact resistance assumptions and interface thermal resistance - which is why SHANYUAN validates simulation against physical thermal cycling data before releasing a custom design to tooling.
Each architecture changes the dielectric system: the coolant loop introduces humidity, condensation and leak risk, so edge sealing and dielectric selection follow the insulation disciplines in insulation testing and dielectric selection.
The interface between a busbar and its cold plate is a contact-resistance problem in thermal clothing. Gap-filling thermal interface materials (TIMs) - greases, pads, phase-change materials - fill the micro-voids between the busbar surface and the cold plate; their effective conductivity depends on thickness, pressure and flatness. The fastening system (bolts with defined torque, spring washers, or clamps) sets the interface pressure, which sets the TIM's squeezed thickness, which sets the thermal resistance. A well-designed interface can deliver 50-100 W/m·K equivalent across the joint; a poor one leaves an air gap that dominates the budget.
The engineering consequence: thermal design of a busbar assembly is inseparable from mechanical design. Torque specifications, flatness tolerances and TIM selection appear in the same review as the electrical stack-up. The DFM checklist treats these as first-class items, and the thermal management resource page carries the working rules.
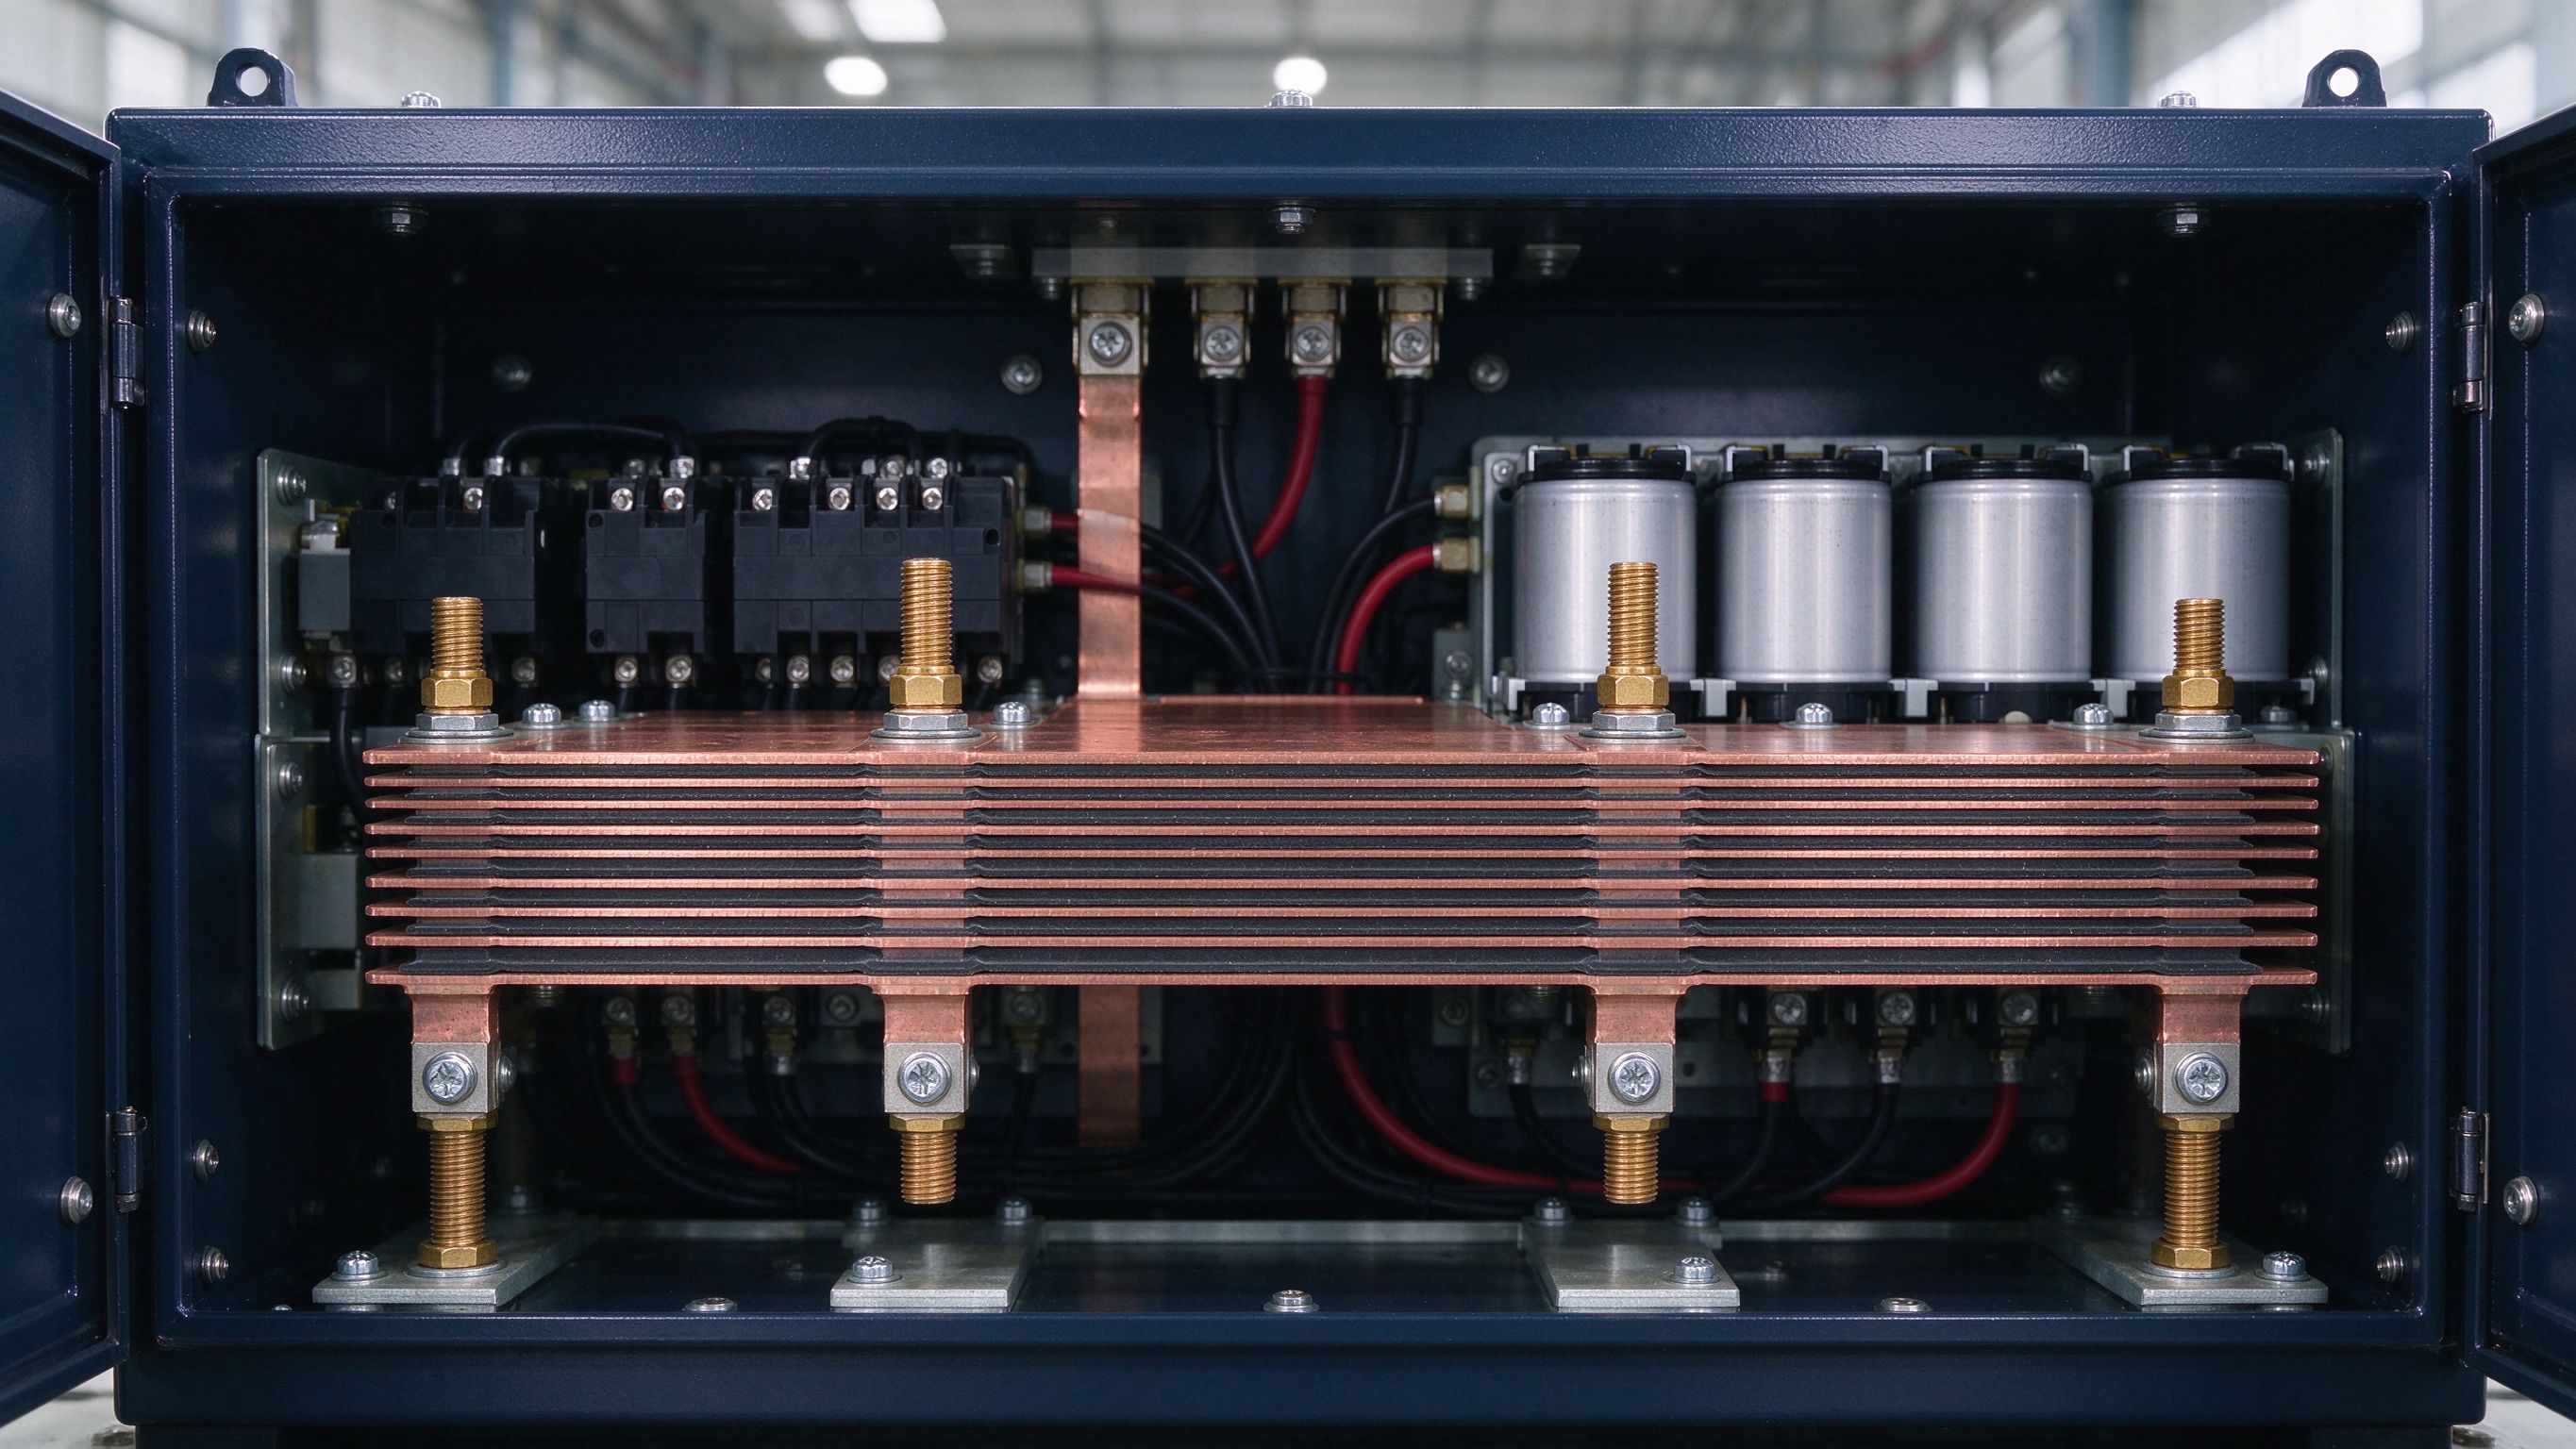
The 30 °C-rise reference assumes sea level, free air and a single bar; real installations deviate on all three axes. Altitude reduces air density and convective heat transfer - a common rule is a small percentage derate per 1000 m above sea level. Bundling multiplies the problem: stacked or closely spaced bars share the enclosure air and derate more steeply than a single bar, which is why module busbar stacks are rated conservatively. Enclosure effects dominate in cabinets: trapped air, neighbouring heat sources and restricted natural convection can cut a free-air rating by 30-50%.
The engineering response is to define the enclosure and cooling in the specification rather than leave it to the field: state the ambient, the enclosure volume and airflow, and the duty cycle; then use the multiplicative derating chain from the ampacity chart. This is also where the custom design review earns its keep - the supplier's thermal model replaces the buyer's guess with a calculation.
Validation measurements must match the specification's cooling assumptions. The standard method: apply the rated DC current with the busbar in its representative mounting (including heat sink or cold plate), measure the conductor temperature at the defined location (typically the hotspot terminal) with thermocouples or thermal imaging, and record the steady-state rise above ambient after thermal stabilisation - usually 1-2 hours or until the temperature changes less than a defined rate.
Thermal imaging adds the field view that thermocouples miss: the whole-temperature map identifies hotspots at terminals, edges and interfaces. The validation report should state ambient, current, cooling configuration, measurement points and the stabilisation criterion - the same discipline SHANYUAN applies when qualifying high-current battery module busbars and DC-link assemblies for series production.
Running this checklist at design review - as SHANYUAN does for every custom busbar - turns thermal management from a field surprise into a calculated property.
No busbar operates alone, and thermal design that stops at the busbar surface misses the point. The integration questions are: where does the busbar's heat go next - into the cabinet air, into a heat sink, into the coolant loop or into a neighbouring component? Is the coolant loop sized for the busbar's contribution, or is the busbar an afterthought on an already-loaded loop? Does the mounting structure conduct heat or insulate? The answers decide whether a good busbar design survives inside a dense cabinet.
The practical discipline is a system heat balance at design review: sum every loss source (busbar, capacitors, fuses, devices, magnetics), check the cooling capability of the enclosure and coolant loop, and identify the hottest component in the assembly - which is often not the busbar but the component it feeds. That system view is exactly what SHANYUAN applies in custom design reviews, and it is the reason the thermal report, not the busbar alone, is the deliverable that protects the design.
A 30 C temperature rise above 40 C ambient, free air, horizontal, single bar - with multiplicative derating for ambient, bundling, altitude and duty cycle.
When loss density exceeds air cooling - roughly above 10 A/mm2 or when natural convection's ~50 W/dm2 budget is exhausted; liquid removes up to 5 kW/dm2.
Published examples: 23-58 C reduction on the conductor with 15 C water, and ~45 C hotspot reduction at 300 A with a 50:50 glycol loop.
Expansion cycles loosen the joint, raising contact resistance; torque retention, spring washers and oxidation-resistant plating are the standard defences.
See how insulation interacts with temperature in insulation testing, how connections survive cycling in welding and joining, and the market context in the 2026 market outlook.
The 30 °C rule is not a ceiling; it is a reference point. The discipline that matters is the full chain: loss calculation, cooling boundary, derating, hotspot verification and validation measurement. A busbar engineered through that chain delivers its rated current predictably - in a depot, a PCS cabinet or a traction inverter - for the life of the system.
MCS moves from pilot to fleet scale in 2026: 1 MW+ charging at 1250 V and up to 3000 A mak
Read article
BloombergNEF sees 158-188 GW of new energy storage in 2026. PCS platforms are climbing fro
Read article
Multiple forecasters put the laminated busbar market near USD 1.0-1.06 billion in 2026, wi
Read articleSend the current profile, voltage class and terminal types — our engineers reply within one business day.
Send drawings, current ratings and voltage class — DFM feedback and a quotation within one business day.