Grid-forming controls turn a battery plant from a follower into a voltage source. The electrical consequence is short, violent current pulses that a continuous-rated busbar was never asked to carry, and the thermal consequence is a cycle count that the insulation sees rather than the copper.
Grid-forming controls turn a battery plant from a follower into a voltage source. The electrical consequence is short, violent current pulses that a continuous-rated busbar was never asked to carry, and the thermal consequence is a cycle count that the insulation sees rather than the copper.
This page is an annual rolling data page: the 2026 edition, refreshed once a year as new market data is published.
A grid-following inverter tracks the grid and injects current in phase with it. A grid-forming inverter behaves as a voltage source behind an impedance, which means it must hold its internal voltage phasor through disturbances and inject current almost instantly when the angle or magnitude moves. The control difference is well documented; the component difference is less discussed.
For the DC side of the plant, three things change. The inverter draws short overload pulses to hold the grid, so the DC busbar carries pulses above its continuous rating. The switching stage works harder during those events, so DC-link ripple and the resulting busbar heating rise. And the plant is expected to ride through faults and contribute current during them, so the busbar's short-time withstand is now part of the grid code compliance argument rather than a protection detail.
The components that feel this first are the DC busbar, the capacitor interface and the terminals. A busbar designed for 1,000 A continuous in a 40 °C container is not automatically a busbar for 1,000 A continuous plus 1,500 A for 200 ms plus 3,000 A for 10 s, even though the copper mass is adequate. The difference is in how the heat is distributed and in how the joints behave at the ends of the pulse.
The stack options that carry this current class are on the power electronics busbar pages, and the ESS application context is set out under energy storage applications.
The published requirements are not uniform, and that matters because a 200 ms pulse and a 10 s pulse stress different parts of the stack. India's Central Electricity Authority has recommended a short-term current overload capability of at least 1.5 pu for a minimum of 200 ms for grid-forming BESS, which is the number used in a growing number of tenders.
By contrast, the Chinese TCES 243-2023 requirement is described in the literature as three times rated current for no less than 10 s, which is a substantially larger energy injection. A 45.6 MW grid-forming BESS connected in Australia's northern grid was reported through CIGRE in 2026 to have verified that overload capability during under-frequency events, with thermal constraints managed by ramping back to continuous rating after 60 seconds.
The engineering implication is that the busbar must be qualified against the specific pulse in the customer's grid code, not against a generic overload figure. A stack that passes 1.5 pu for 200 ms has demonstrated a short thermal transient. It has not demonstrated the 30-fold energy of a 3× 10 s event, and the layer-to-layer temperature spread in the second case is a different problem entirely.
Continuous rating practice and derating are covered in the ampacity chart and the ampacity calculator.
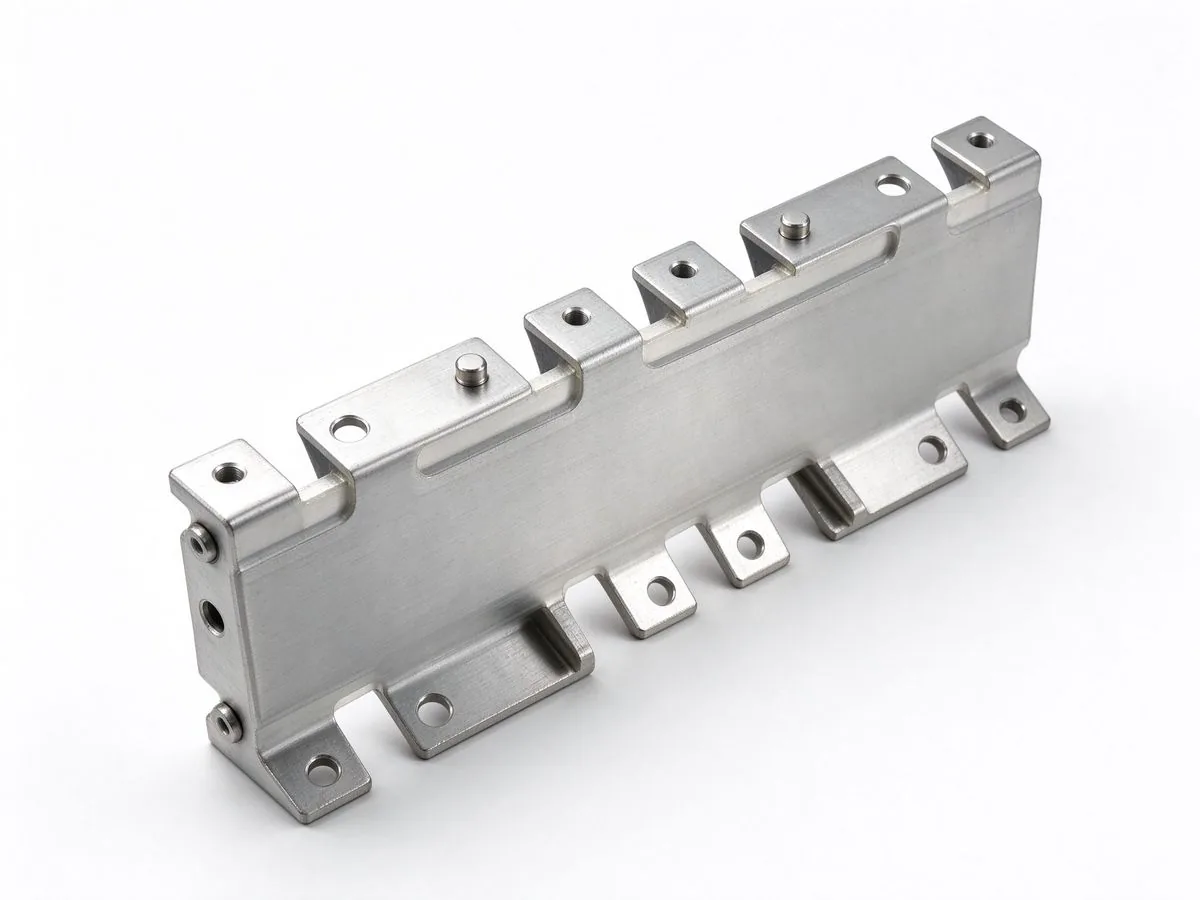
During a 200 ms pulse, the copper heats almost adiabatically: the heat generated has nowhere to go in that window, and the temperature rise is governed by the current density, the copper mass and the heat capacity. For a 10 s pulse, convection and conduction begin to matter, and the temperature rise is lower than the adiabatic estimate but lasts longer, which shifts the stress from peak temperature to thermal cycling of the insulation and the joints.
A rule of thumb helps only as a first check. Adiabatic temperature rise for copper is roughly proportional to (J² × t), where J is current density in A/mm² and t is time in seconds. A 150 mm² bar carrying 1,500 A has a current density of 10 A/mm²; over 200 ms that produces a few degrees of rise, which is comfortable. The same bar at 3,000 A for 10 s sees 20 A/mm² and a much larger excursion, and the calculation stops being a check and becomes a design constraint.
That is why a grid-forming busbar is often specified with a larger cross-section than the continuous current needs. The copper is not there for steady-state ampacity; it is there to absorb the pulse. The cost of that copper is small compared with the cost of a container that fails a grid-code witness test.
Thermal design for stacks is treated in thermal management, and the layer-count trade-off in layer-count selection.
A laminated busbar splits current across layers, and the split is set by resistance, which is set by temperature. In continuous operation the layers reach a stable, slightly unequal distribution. In a pulse, the distribution becomes dynamic: the layer closest to the cold plate or the airflow stays cooler and takes more current, while the inner layers heat faster and take less, and the redistribution happens on a thermal time constant measured in seconds.
The practical consequence is that the hottest layer runs hotter than the average by more than a steady-state calculation predicts. If the design assumes equal sharing, the margin is consumed twice: once by the pulse and once by the imbalance. Measuring the imbalance on a prototype requires thermocouples on each layer or an infrared scan through a window, and it is worth doing once per stack design rather than per project.
Layer count interacts with this. More layers reduce inductance and improve ripple behaviour, but they also create more internal interfaces where heat has to cross. A four-layer stack with a thin dielectric is thermally worse per unit of copper than a two-layer stack of the same total mass, which is why the layer-count decision for a grid-forming DC bus is a compromise between ripple and thermal spread rather than a pure inductance optimisation.
Measured current-sharing practice is described in thermal cycling reliability.
Grid-forming inverters operate with tighter voltage control and faster current loops than grid-following equipment, and the DC link is the buffer that makes that possible. The busbar's inductance sits between the capacitor bank and the switching devices, and every nanohenry of it converts ripple current into a voltage deviation that the control loop then has to correct.
For a laminated DC bus, the achievable inductance depends on the return path geometry and the dielectric thickness. A well-designed four-layer stack reaches single-digit nanohenries, which is the range that makes a film capacitor bank effective at the switching frequency. A stack built without a dedicated return layer, or with the return routed around the edge, can be an order of magnitude worse and will show up as voltage overshoot on the first prototype.
The design method for this is the same one used in traction and industrial drives: keep the return layer directly above the outgoing layer, minimise the loop area, and bring the capacitor terminals to the point where the current commutes. The grid-forming addition is that the capacitor bank is often larger and further away than in a traction inverter, so the busbar has to do more of the work.
The geometry rules for low-inductance stacks are in low-inductance design.
Grid-forming plants are expected to contribute current during faults, which means the DC bus sees a short, high-current event that is not a bolted fault on the DC side but is the DC-side reflection of an AC-side disturbance. The current can approach the overload limit and, in a weak grid, persist longer than the inverter's nominal fault ride-through window.
Mechanically, the busbar responds to the square of the current. A stack rated for 1,000 A sees roughly 2.25 times the force at 1,500 A and nine times the force at 3,000 A, applied in the same direction as the steady-state force. Bracing designed for the continuous case is usually adequate for 1.5 pu, but not always for 3× pulses repeated across a commissioning test sequence.
The other mechanical input is thermal expansion. A pulse heats the copper, the stack expands, and the terminals constrain it. Repeated pulses produce a ratcheting load at the terminal interface, which is where fatigue failures appear first: a cracked weld, a loosened stud or a lifted insulation bond at the end of the bar. The busbar that survives a single witness test can still fail the hundredth cycle.
Short-circuit verification methods are set out in short-circuit withstand.
In a conventional plant the busbar's short-circuit withstand is a protection coordination input. In a grid-forming plant it is also evidence for the grid operator that the plant can stay connected and contribute during a disturbance. That changes the documentation burden: the test record has to state the current, the duration and the condition, and it has to be traceable to the design that was installed.
The IEC and UL framework for assemblies provides the test methods, and the emerging grid-forming guidelines add functional requirements on top. IEEE PES has documented the move of inverter-based resource standards into mandatory status for larger plants in North America from October 2026 and January 2027 depending on size and voltage, which is the clearest signal that the functional requirements are becoming enforceable rather than advisory.
For a component supplier, the practical output is a test dossier: the short-time current and duration the assembly was verified at, the temperature reached, the condition of the joints afterwards, and the protection device assumed upstream. A customer assembling a grid-code submission can drop that dossier into the package instead of commissioning a separate test.
The standards behind assembly testing are indexed in the standards hub.
A bolted or welded terminal has a contact resistance in the micro-ohm range, and at 1,000 A that is a few watts. At 3,000 A it is nine times that, concentrated in a joint with much less mass than the bar behind it. The joint heats faster than the conductor, and the heat has only the bar and the hardware to diffuse into.
Two design responses are standard in high-pulse applications. The first is more contact area: a larger stud, a wider blade or a double-bolt pattern reduces the current density in the joint. The second is a shorter thermal path: a terminal lug that is directly welded to the bar conducts heat away faster than a bolted joint with a washer stack. Both cost money, and both are cheaper than a joint that anneals and loosens after a commissioning sequence.
Torque control belongs in this discussion too. A joint torqued to the low end of its window has a higher resistance than one at the nominal value, and the difference is small in continuous operation but visible at pulse current. Specifying a torque window and verifying it on the line is a quality control measure that pays for itself in grid-forming duty.
Terminal options and torque windows are in busbar connections and terminal machining.
The insulation on a grid-forming DC bus does not see a higher continuous temperature than on a grid-following bus of the same rating. It sees more cycles: the pulse heats the stack, the ramp-back cools it, and the cycle repeats with every frequency event. For a plant providing frequency support, that can be several cycles a day for fifteen years.
Thermal cycling stresses the insulation in two ways. Differential expansion between copper and film works the bond line, and repeated working can create voids at the conductor edge, which is where partial discharge begins. And the maximum temperature reached during the pulse, even briefly, accelerates ageing in a way that the average temperature does not capture.
The specification response is to state the cycle profile rather than only the temperature class: pulses per day, current and duration, cooling condition, and the number of cycles over life. A dielectric that passes a steady-state heat soak may still fail a 5,000-cycle pulse profile, and the test that reveals it is a cycling test with PD measurement at intervals rather than a single hipot at the end.
Dielectric behaviour under cycling is covered in partial discharge and dielectric selection.
A qualification programme for grid-forming duty has four stages, and the sequence matters because each stage informs the next. Start with a continuous thermal test at the installed condition to establish the baseline temperature distribution across layers and terminals. Then run the short pulse at the grid-code value, measuring the peak temperature and the recovery time.
The third stage is the long pulse, at the duration and current the customer's code requires, with the ramp-back to continuous rating included. This is the stage that reveals joint problems and current-sharing imbalance, because the stack has time to redistribute heat. The fourth stage is the cycle test: repeat the pulse-and-recover profile to a representative count, with insulation resistance and partial discharge measured at intervals.
Between stages, inspect the hardware. A joint that has changed colour, a stud that has lost torque, a film that has lifted at the edge or a coating that has cracked are all findings that a temperature log alone will miss. The inspection record is part of the qualification, not an afterthought.
Type-test and routine-test practice is described on the quality page.
Three frameworks are converging. In North America, IEEE PES documents the mandatory status of inverter-based resource standards for plants above 75 MVA at 100 kV from 1 October 2026 and above 20 MVA at 60 kV from 1 January 2027. In India, the CEA recommendation for 100 percent grid-forming inverters in upcoming BESS projects includes the 1.5 pu / 200 ms overload expectation and oscillation damping in the 0.1–20 Hz band.
In China, GB/T 47655-2026 on grid-forming performance requirements and test methods for power electronic equipment was published in July 2026 with implementation in 2027, alongside the older TCES 243-2023 requirement for three-times overload. The frameworks differ in numbers and in verification method, which is exactly why a supplier should map its test dossier to the customer's jurisdiction rather than to a single international reference.
The common thread is that all three move the requirement from a control-function description to a measurable performance with a test method. That is good news for component suppliers: a measurable requirement can be designed against and verified, while a functional aspiration cannot.
Regional standard coverage is indexed in the standards hub.
A grid-forming busbar RFQ that produces comparable quotes specifies five things beyond the continuous rating. The continuous current at the installed ambient. The overload profile: magnitude, duration, repetition and the recovery window. The fault current and duration the assembly must survive. The cooling arrangement at the busbar, including whether a cold plate is bonded to one side. And the cycle count over life with the test method the customer will accept.
Suppliers should answer with more than a cross-section. A useful response states the continuous temperature rise, the predicted pulse temperature at each layer, the current-sharing assumption, the joint design and torque window, and the test plan that will demonstrate all of it. That response is what lets an EPC compare two quotes that look similar on price but differ by a qualification campaign.
For programs still choosing a stack, the earlier conversation is cheaper: send the pulse profile and the container layout, and ask for a thermal and mechanical review before the DC bus geometry is frozen. The pulse is the design driver, and a geometry chosen for continuous current will be re-cut once the grid-code test arrives.
Send the pulse profile through the engineering contact; custom DC bus geometry is scoped on the custom build page.
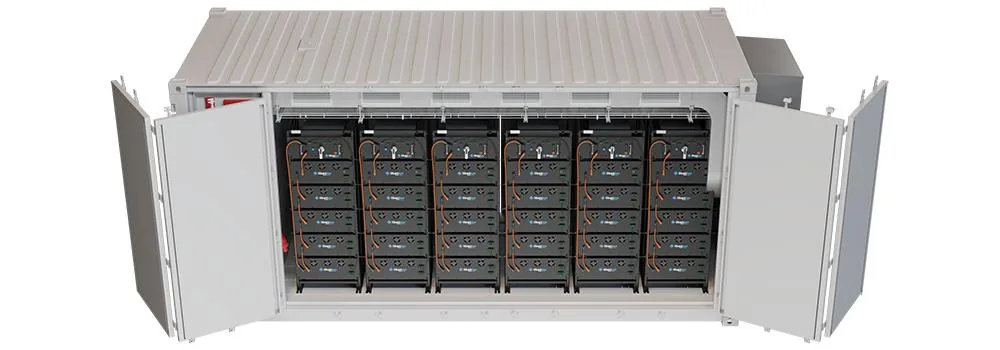
ERCOT's record 2.2 GW storage quarter and SNE's 73% global ESS shipment jump are reshaping
Read article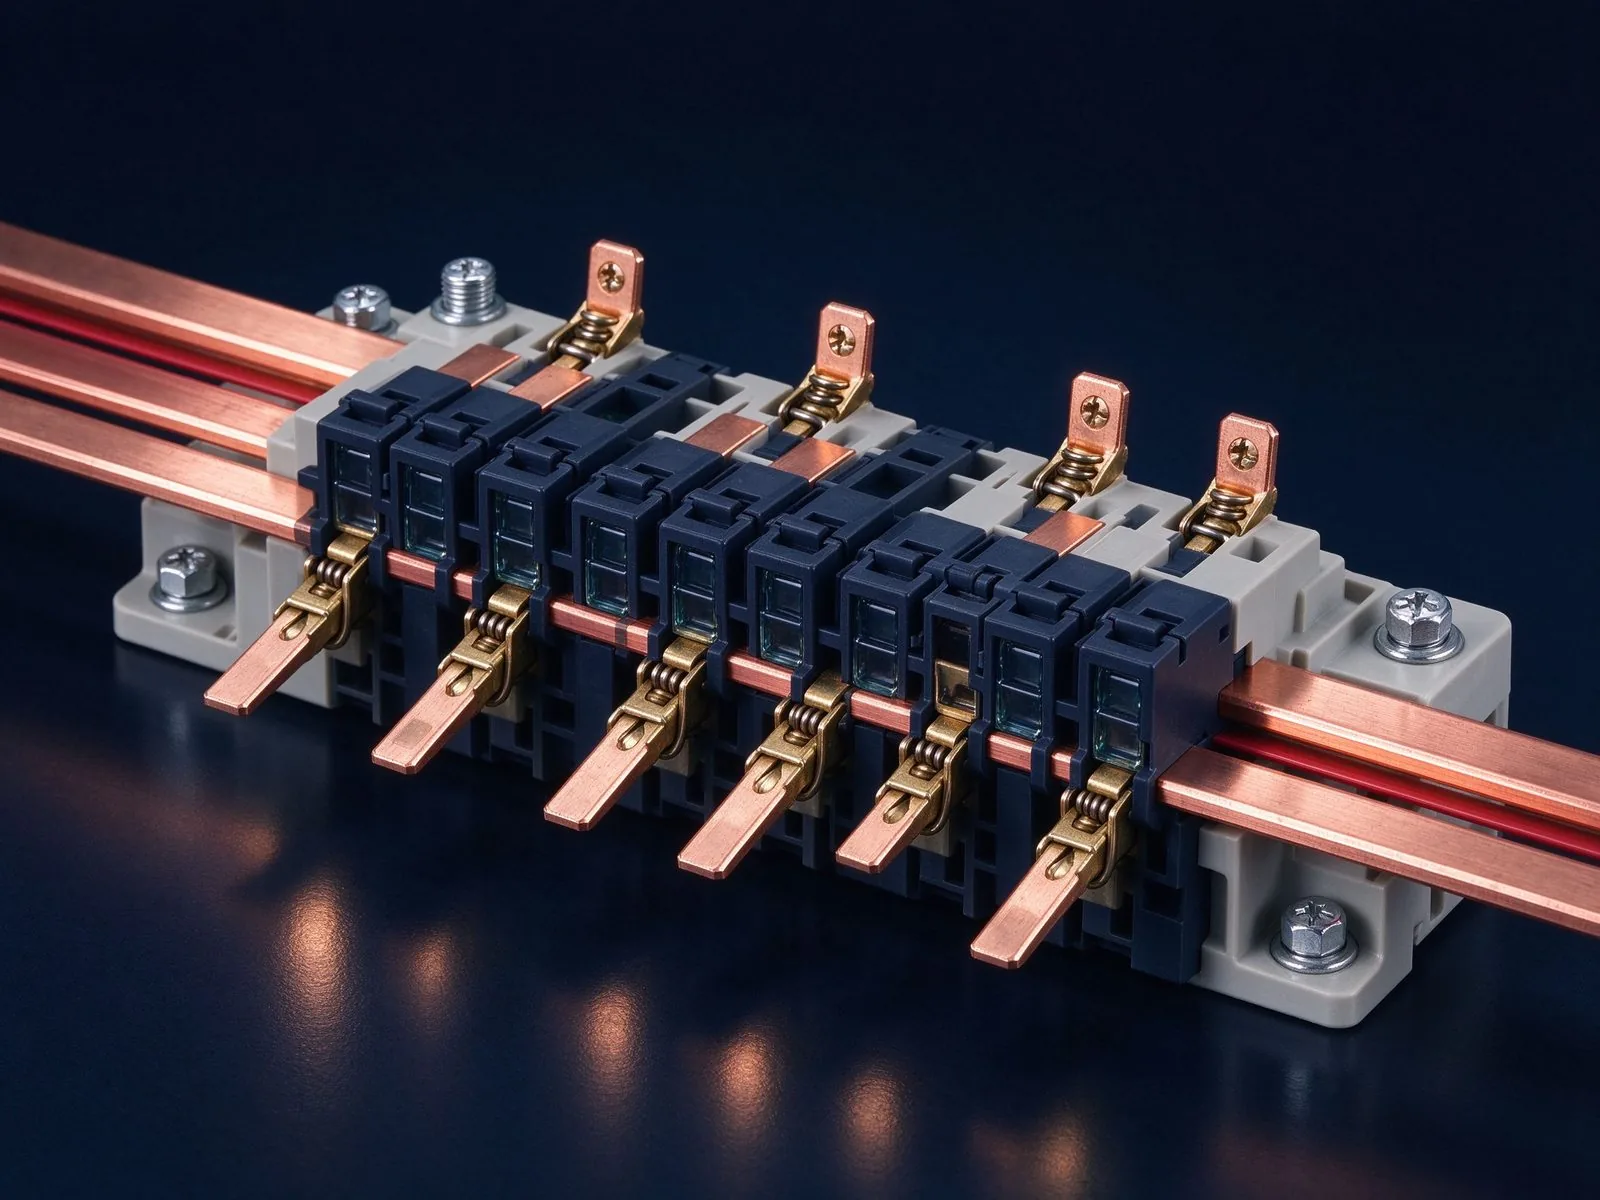
A short circuit is the busbar's worst moment: tens of kiloamps peak, forces in kilonewtons
Read article
Elena Vasquez is a power electronics application engineer with 10 years of experience integrating laminated busbars into EV inverters, charging systems and energy-storage PCS. She specializes in low-inductance DC-link design, EMC behaviour and converter packaging, and holds a B.Sc. in Electrical Eng
Send the current profile, voltage class and terminal types — our engineers reply within one business day.