A busbar fails slowly, not suddenly: heat ages the dielectric, and the dielectric ages the system. This guide covers the thermal resistance model, why natural convection is usually enough, why a black outer surface lowers the temperature, and how to choose the thermal class.
Thermal management is reliability management, at two very different time scales. In the short term, a local hot spot, an overloaded joint or blocked cooling, can destroy a semiconductor junction instantly. In the long term, heat is what kills the busbar itself: elevated temperature accelerates degradation of the plastics, which become brittle as heat speeds up cross-linking and lose all flexibility. The most common long-term busbar failure is insulation brittleness and cracking, leading to electrical breakdown.
Reference lifetime figures by insulation class, in typical traction duty:
| Insulation | Rating | Reference lifetime |
|---|---|---|
| Standard polyester (PET) film | 105 °C class | ≈ 25 years at 80 °C |
| High-temperature film | 130 °C class | ≈ 40 years at 100 °C |
The underlying rule is the Arrhenius relationship: every 10 °C rise halves the insulation lifetime, and every 10 °C fall doubles it. To assess real useful life you need the mission profile, the percentage of time spent at each temperature. Knowing only the peak temperature is not enough. That is why we ask for duty cycles, not just currents, when we size a part: a part that sits at 60 °C for 95% of the year and 120 °C for 5% of it lives far longer than a part pinned at 90 °C continuously.
The two time scales are easy to mix up. A local hot spot at an IGBT junction, from insufficient cooling or a momentary overload, can destroy the semiconductor instantly; the busbar dielectric around it may never notice. The busbar's own killer is slower and silent: as heat accelerates cross-linking in the polymer, the film turns brittle, loses elongation, cracks at the edges, and the crack becomes an electrical breakdown path. That sequence is why insulation class is chosen against the mission profile, not against the momentary overload.
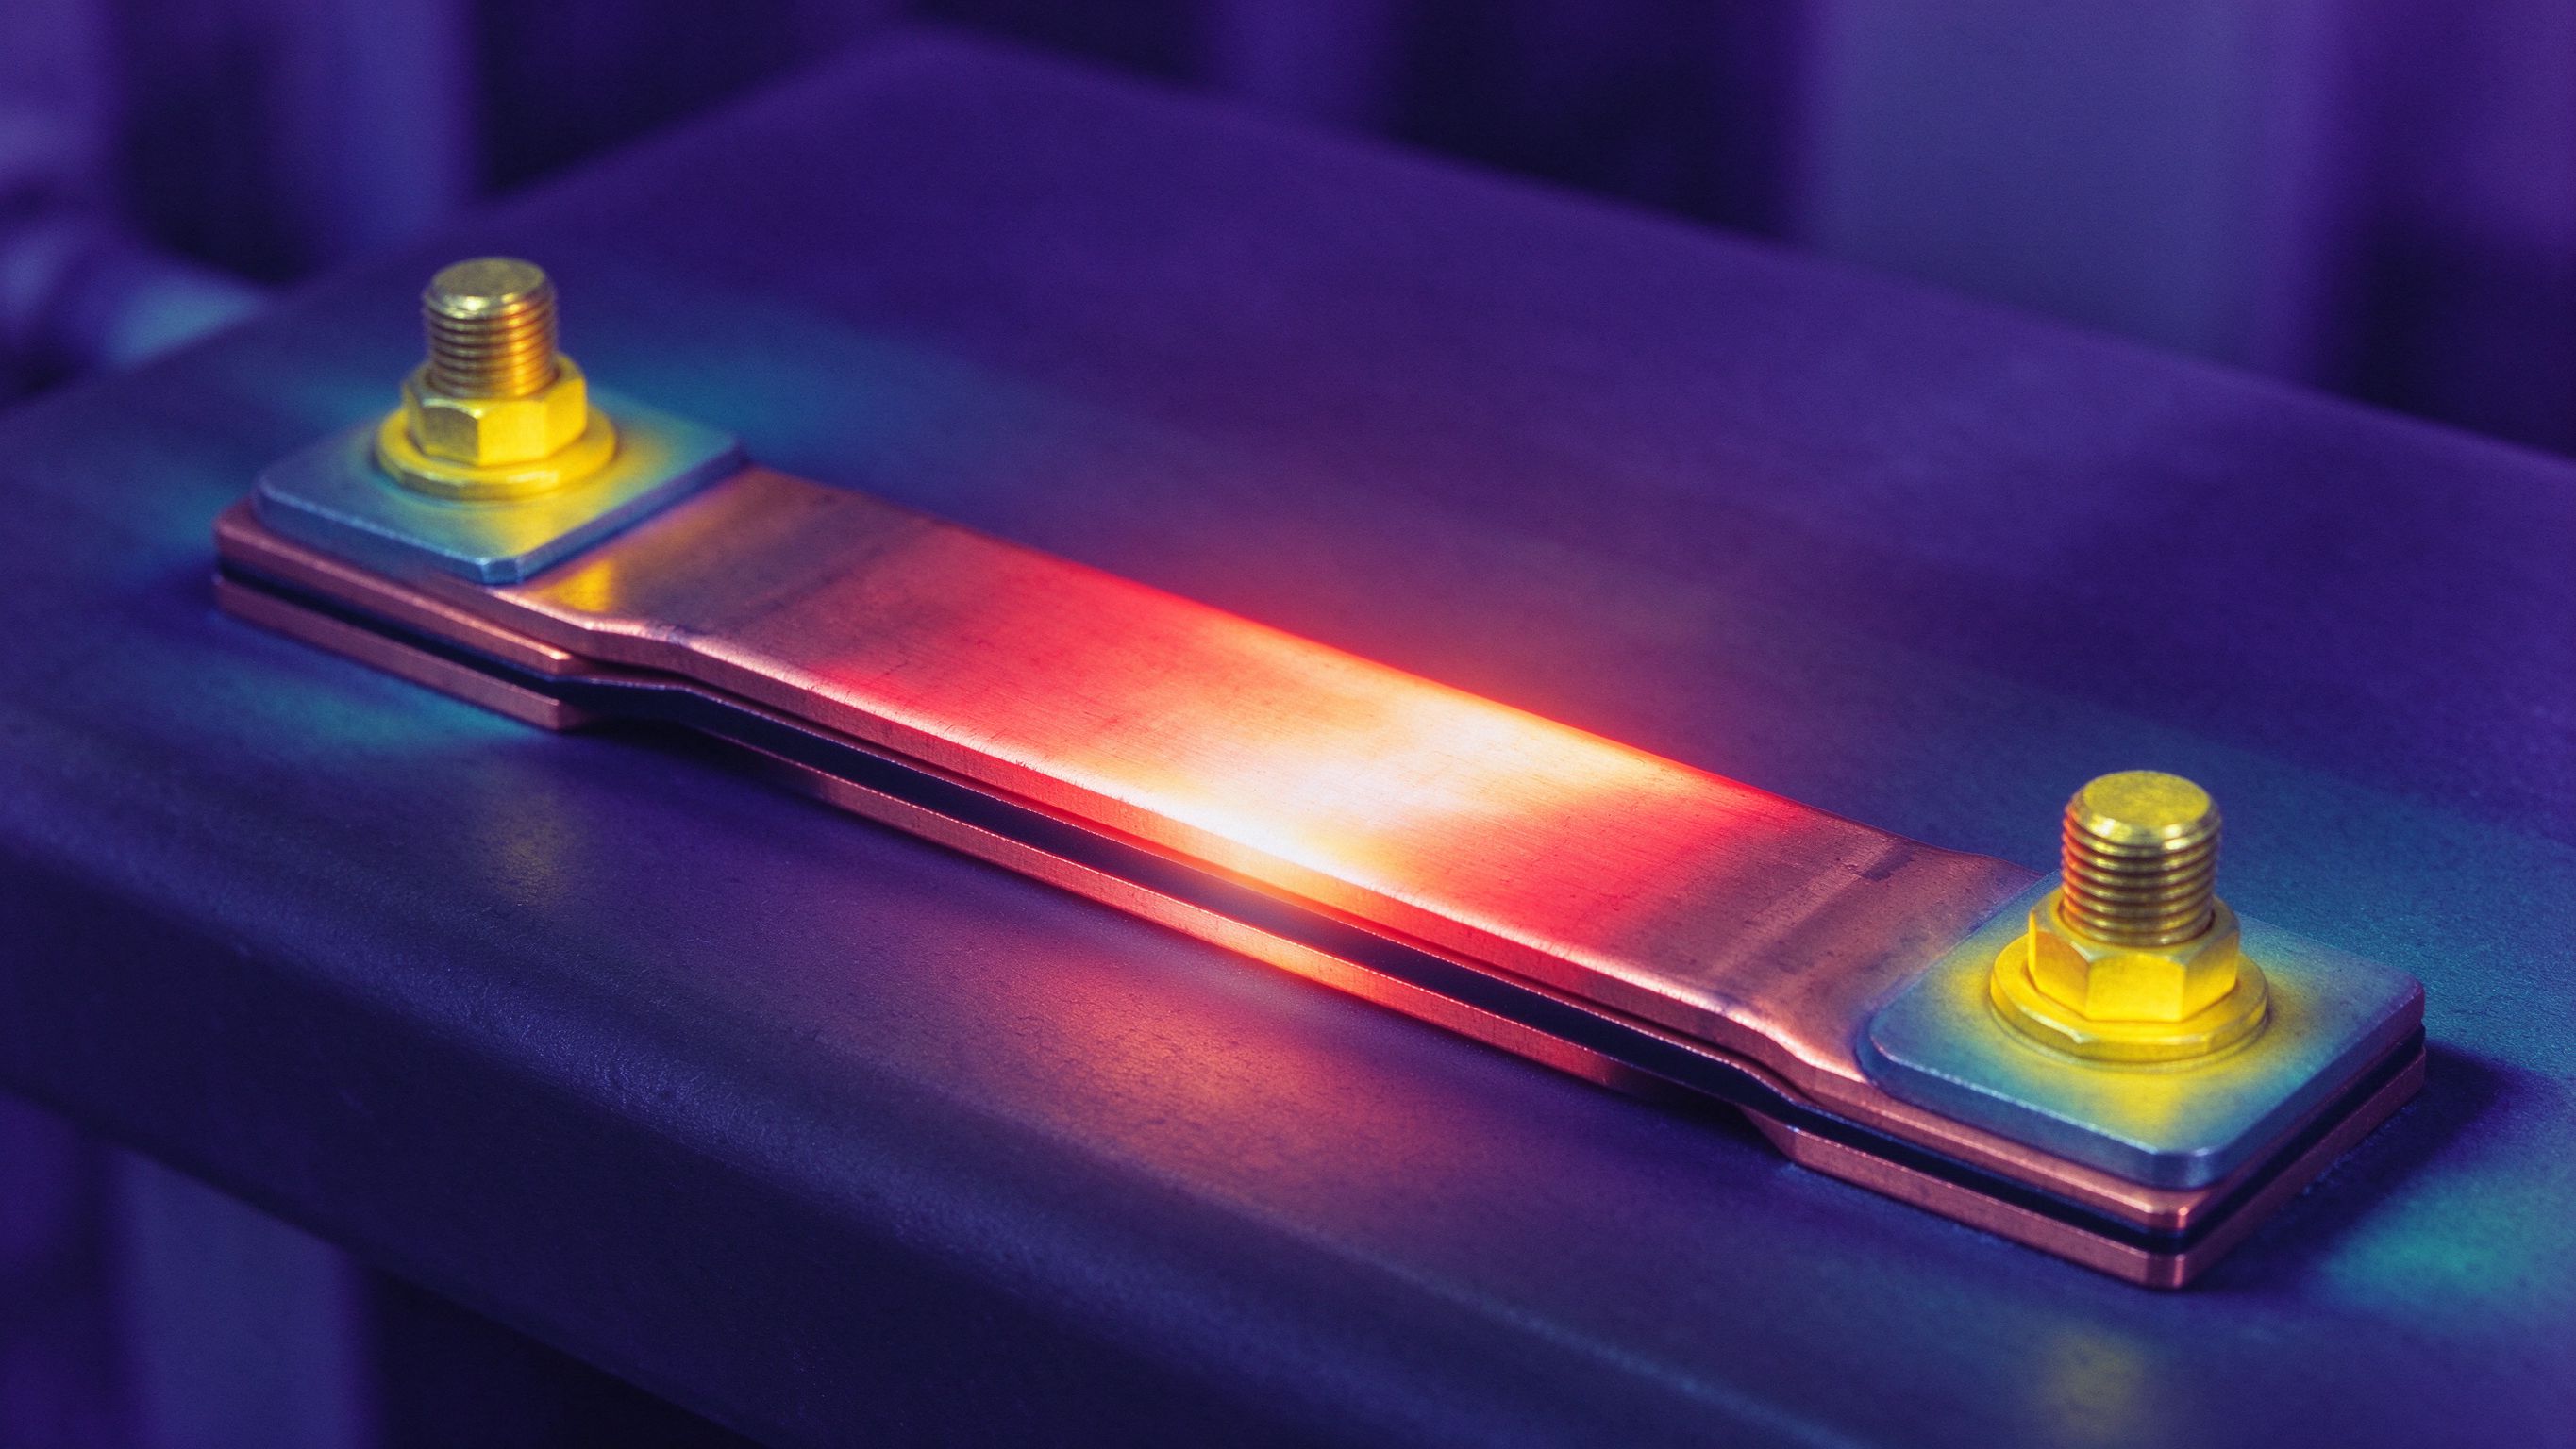
Heat generated per unit of outer surface gives the thermal flux, Q = Ploss / A, in W/m², and the temperature relationship follows Q = ΔT / Rt. This is the exact analogue of Ohm's law: thermal flux Q is like electric current, the temperature difference ΔT is like voltage, and the thermal resistance Rt is like electrical resistance. For a given flux, higher Rt means a hotter hot spot.
Total Rt is the sum of every thermal barrier from the heat source to ambient: Rt = Rcond + Rconv + Rrad, conduction through the part, convection to the air, and radiation to the surroundings. The design goal is to halve the total Rt where you can: halving Rt doubles the allowable power loss for the same hot-spot temperature, or lets you push more current through the same part.
The analogy is exact enough to design with. If you want the hot spot cooler, you do not simply add more copper; you reduce Rt somewhere on the path from the lossy conductor to ambient. The practical levers, in order of impact, are the ones in the next sections: get the outer surface to shed heat, then worry about everything inside the part. Notice what the model says about altitude: thin air lowers both convection h and insulation strength, and the thermal half of that derating is just a smaller h in the same equation. When you ask us to derate for a high-altitude site, we recompute Rconv with a realistic h for the density, not a generic percentage. For the current-side numbers that pair with this model, see our busbar ampacity chart and its derating factors.
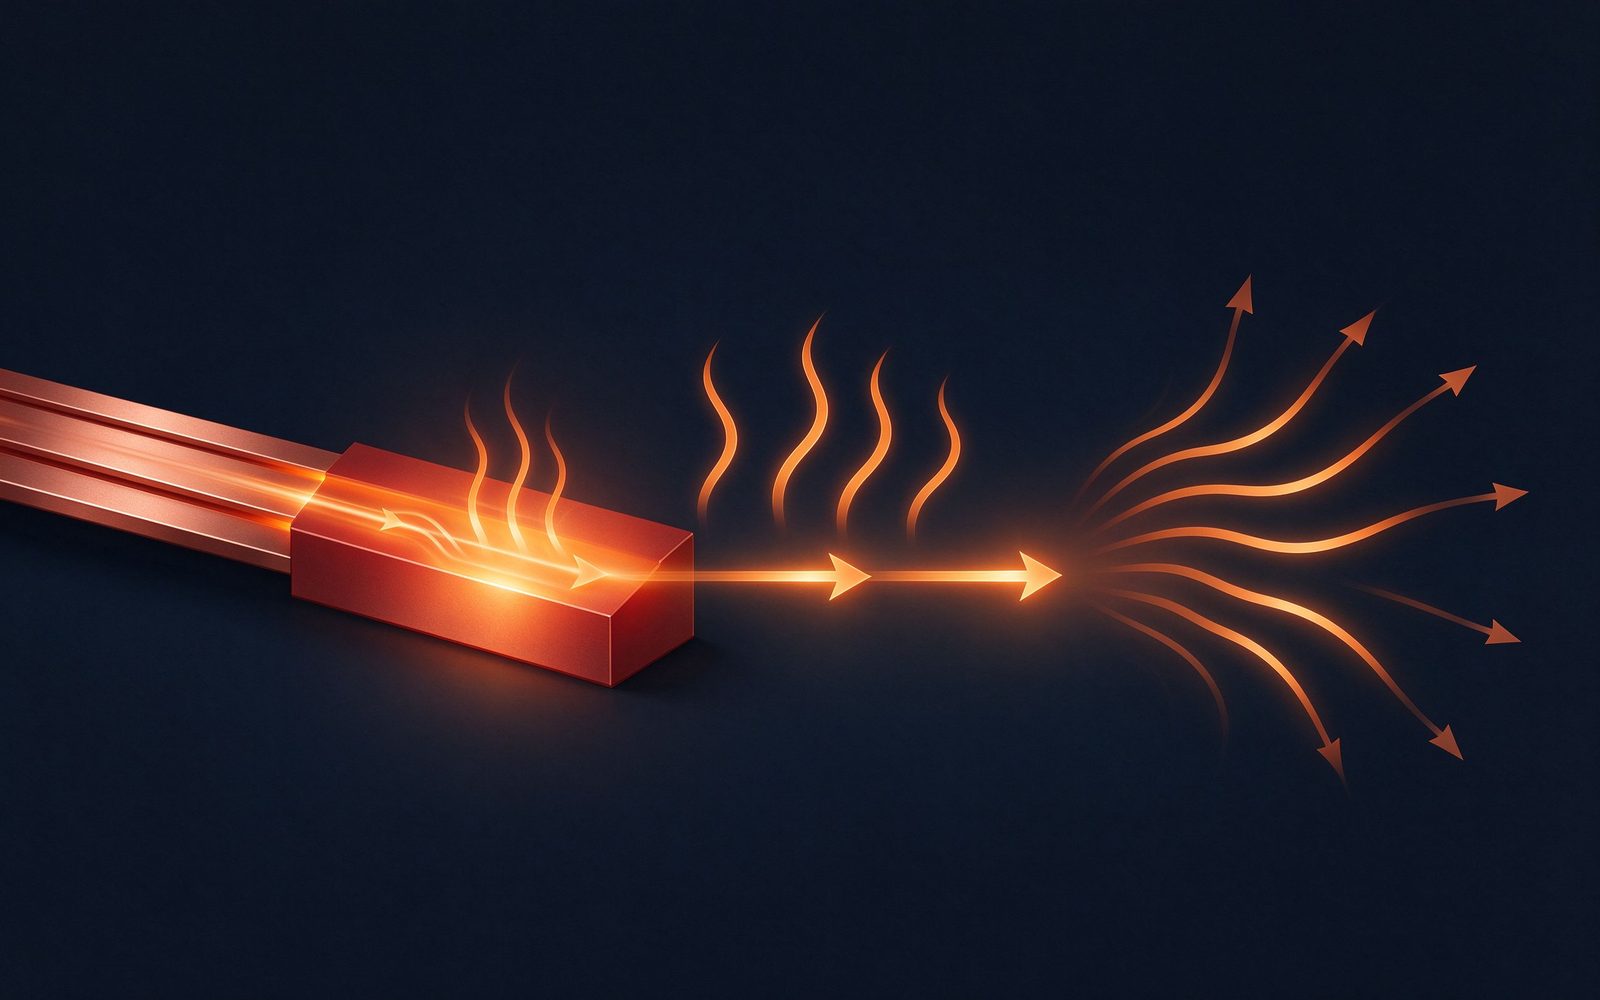
Inside the busbar, conduction resistance is Rcond = d / (K × A): conduction distance d, thermal conductivity K, cross-section A. Heat is generated throughout the conductor body and conducted to the outer surface.
At a heat flux of about 3 W/dm², the temperature drop across the materials looks like this:
| Material | Thermal conductivity K (W/m·K) | Thickness | Temperature drop across part |
|---|---|---|---|
| Copper | 370 | 10 mm | ≈ 0.01 °C |
| Aluminum | 230 | 10 mm | ≈ 0.01 °C |
| Polyester film | 0.2 | 0.44 mm | ≈ 0.66 °C |
| Rigid glass-reinforced insulator | 0.8 | 6 mm | ≈ 2.25 °C |
Conclusion: internal conduction resistance is not the limiting factor. Power-loss density in a busbar is low, and copper and aluminum spread heat extremely well, smoothing the hot spot across the whole part. Even a 6 mm rigid inter-layer board drops only about 2.25 °C across itself. The table has a second lesson: stacking 3, 4 or 6 insulated layers does not heat the stack the way intuition expects, because the dielectric layers are thermal resistors of millidegree scale, not degree scale. It also explains why parallel thin conductors behave well thermally: every foil edge sits close to the outside, so heat never travels far. Where they matter is electrical, not thermal: thickness, voltage and PD margin, as covered in our partial discharge design guide. The conductor material choice therefore matters far more for electrical and mechanical reasons than for heat spreading; we go deeper into that trade in copper vs aluminum busbar conductors.
Once heat reaches the outer cooling surface, it leaves by convection and radiation. The flat, thin laminated geometry has a very large surface for its volume, a built-in thermal advantage a packaged semiconductor can never have. Typical heat-flux capability by cooling mode:
| Cooling mode | Typical heat flux removed |
|---|---|
| Natural convection | ≈ 5 W/dm² |
| Forced air (fan) | ≈ 50 W/dm² |
| Forced water | up to ≈ 5 kW/dm² |
The reason busbar cooling is almost a solved problem is the ratio: conduction losses of 10–100 W against IGBT junction losses of 1–5 kW. The semiconductor needs a designed cold plate; the busbar just needs to not be boxed in. In a natural-cooling sizing example with a 30 °C rise limit and h = 20 W/m²·K on both faces, about 6 W/dm² can be dissipated naturally; a 25 × 40 cm busbar easily sheds 60 W this way.
Two practical notes. Orientation matters: in measured double-sided cooling at 8.5 W/dm², horizontal mounting gave a 42 °C rise while vertical mounting gave 37 °C; vertical orientation raises total heat transfer by about 20%, and the horizontal bottom side is the least efficient surface. Forced fan cooling raises h to 50–100 W/m²·K, increasing heat removal by a factor of 5–10 and allowing roughly 2–3× higher currents than natural cooling. The corollary to avoid: if a high-power inverter is forced to air-cool instead of water-cool, its whole rating drops to about 40%, and the busbar has to be re-derated with it.
If you are sizing by hand rather than simulation, the safe order is: start from the ampacity chart at natural cooling, subtract the enclosure derating, then ask whether the inverter's own airflow adds margin. A busbar inside a sealed cabinet with no airflow needs the conservative number; the same part inside a fan-cooled stack often has headroom the conservative number hides. Water-cooled busbar designs exist but are rare; they appear when the busbar is deliberately used as a cooled distribution plate in very high-density converters. For the other parts, the message is simple: design for natural cooling, respect orientation, and let the inverter's fan help.
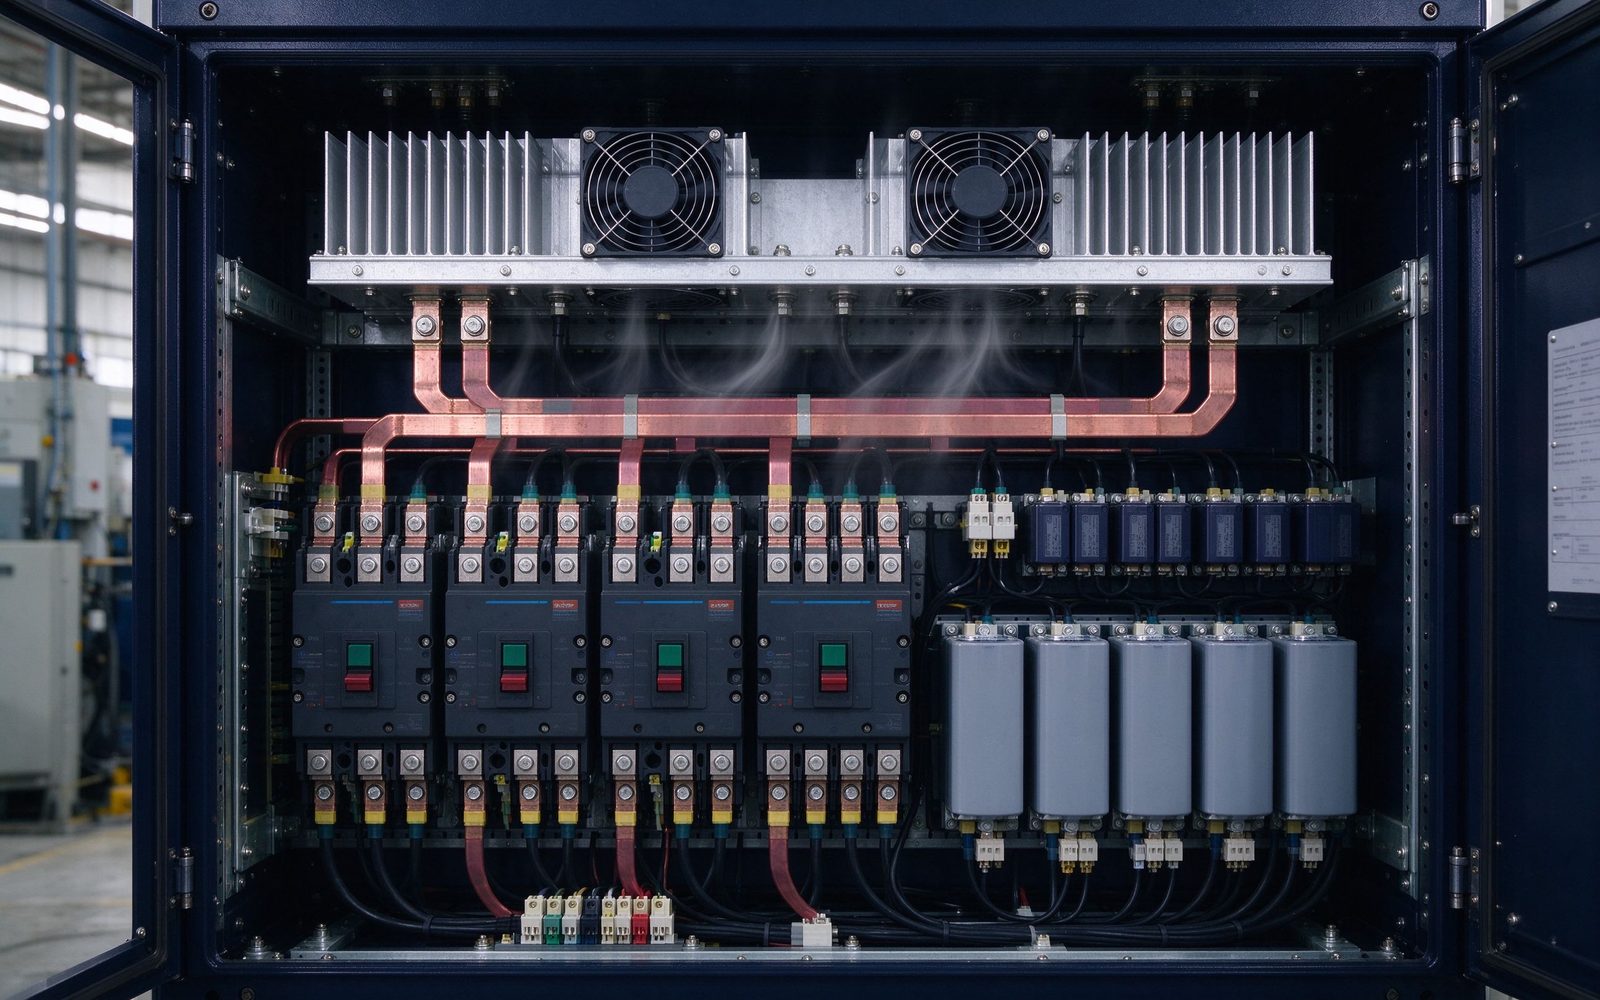
Radiation follows the Stefan–Boltzmann law: Q̇ = ε × σ × A × (T_surface⁴ − T_surround⁴), with σ = 5.67 × 10⁻⁸ W/m²·K⁴. The interesting variable is emissivity ε:
| Surface | Typical emissivity ε |
|---|---|
| Black anodized aluminum | ≈ 0.86 |
| Polished aluminum | ≈ 0.04 |
| Polished copper | ≈ 0.03 |
| Tarnished copper | ≈ 0.75 |
| Black paint | ≈ 0.95 |
| Grey or white paint | ≈ 0.90 |
The practical consequences are worth internalizing. Bare metals barely radiate, ε ≈ 0.04, while painted surfaces reach about 0.9–0.95 regardless of color. On a naturally cooled part, radiation contributes roughly 40% of total heat removal and convection about 60%, so laminating or painting the outer face black actually lowers the conductor temperature. Measured example on the same busbar: a black-painted outer surface gave a 44 °C rise; bare copper with only small tape patches gave 70 °C, a 26 °C difference, about 40% lower temperature. It is counter-intuitive, because you expect added insulation to heat the part up.
Why does painted insulation lower temperature? The film or paint's emissivity, around 0.9, replaces the bare copper's, around 0.03, so the part radiates far more longwave energy. Once forced fan cooling dominates, radiation becomes negligible, which is why forced-air heatsinks are usually left as uncoated aluminum while natural-cooled ones are painted black. One more consequence for the production floor: a bare copper edge left exposed by an oversize mask is not just an isolation concern, it is a hot spot surrounded by a part that cannot radiate. Keep the outer face covered, and the whole stack runs cooler.
One measurement tip: an IR camera cannot correctly read bare conductors, because they emit almost no longwave radiation and the surface reflects the camera's view. Paint the spot black before you measure.
The dielectric is what sets the maximum continuous temperature of the assembly. RTI, Relative Temperature Index, is defined under UL 746 as the temperature at which a key property, mechanical elongation or electrical breakdown strength, retains half its initial value for at least 20 000 hours. Standard 105 °C-rated polyester insulation shows roughly 60 000-hour lifetime at 105 °C in electrical-breakdown testing.
Reading the numbers operationally: a 105 °C film at an 80 °C hot spot has roughly 25 years ahead of it in traction duty; a 130 °C film at 100 °C has about 40. The commercial lever runs the other direction too: instead of shrinking the conductor to hit a temperature target, stepping up to a 130 °C-rated dielectric lets you push more current through an unchanged copper section, upgrading an existing design's power rating without re-engineering the stack.
That is how traction platforms and renewable inverters usually buy extra margin. In traction converters, where wide temperature swings and humidity meet long service targets, the 130 °C grade with an extended humidity rating is the established choice; see our rail traction busbar page. In renewable inverters that run essentially continuously, it buys margin when cooling space is tight; see solar and wind inverters.
When not to step up: if your hot spot already sits well below the film rating, a 130 °C dielectric buys you nothing but cost and thickness. The upgrade case is specifically when the conductor cross-section is constrained, by weight, space or tooling, and the dielectric rating is the cheapest way to recover the lost rating. The pattern across this guide repeats: the limiting resistance sits at the surface, not inside the part. If you remember one number, remember the 40% radiation share on a naturally cooled part. Send us both scenarios and we will show the trade rather than assume. Material selection is covered in depth in our dielectric selection guide, and the overall release checklist is in the design guide. Send us your mission profile, ambient, duty cycle and required service life, through contact engineering, and we will size the thermal class with you.
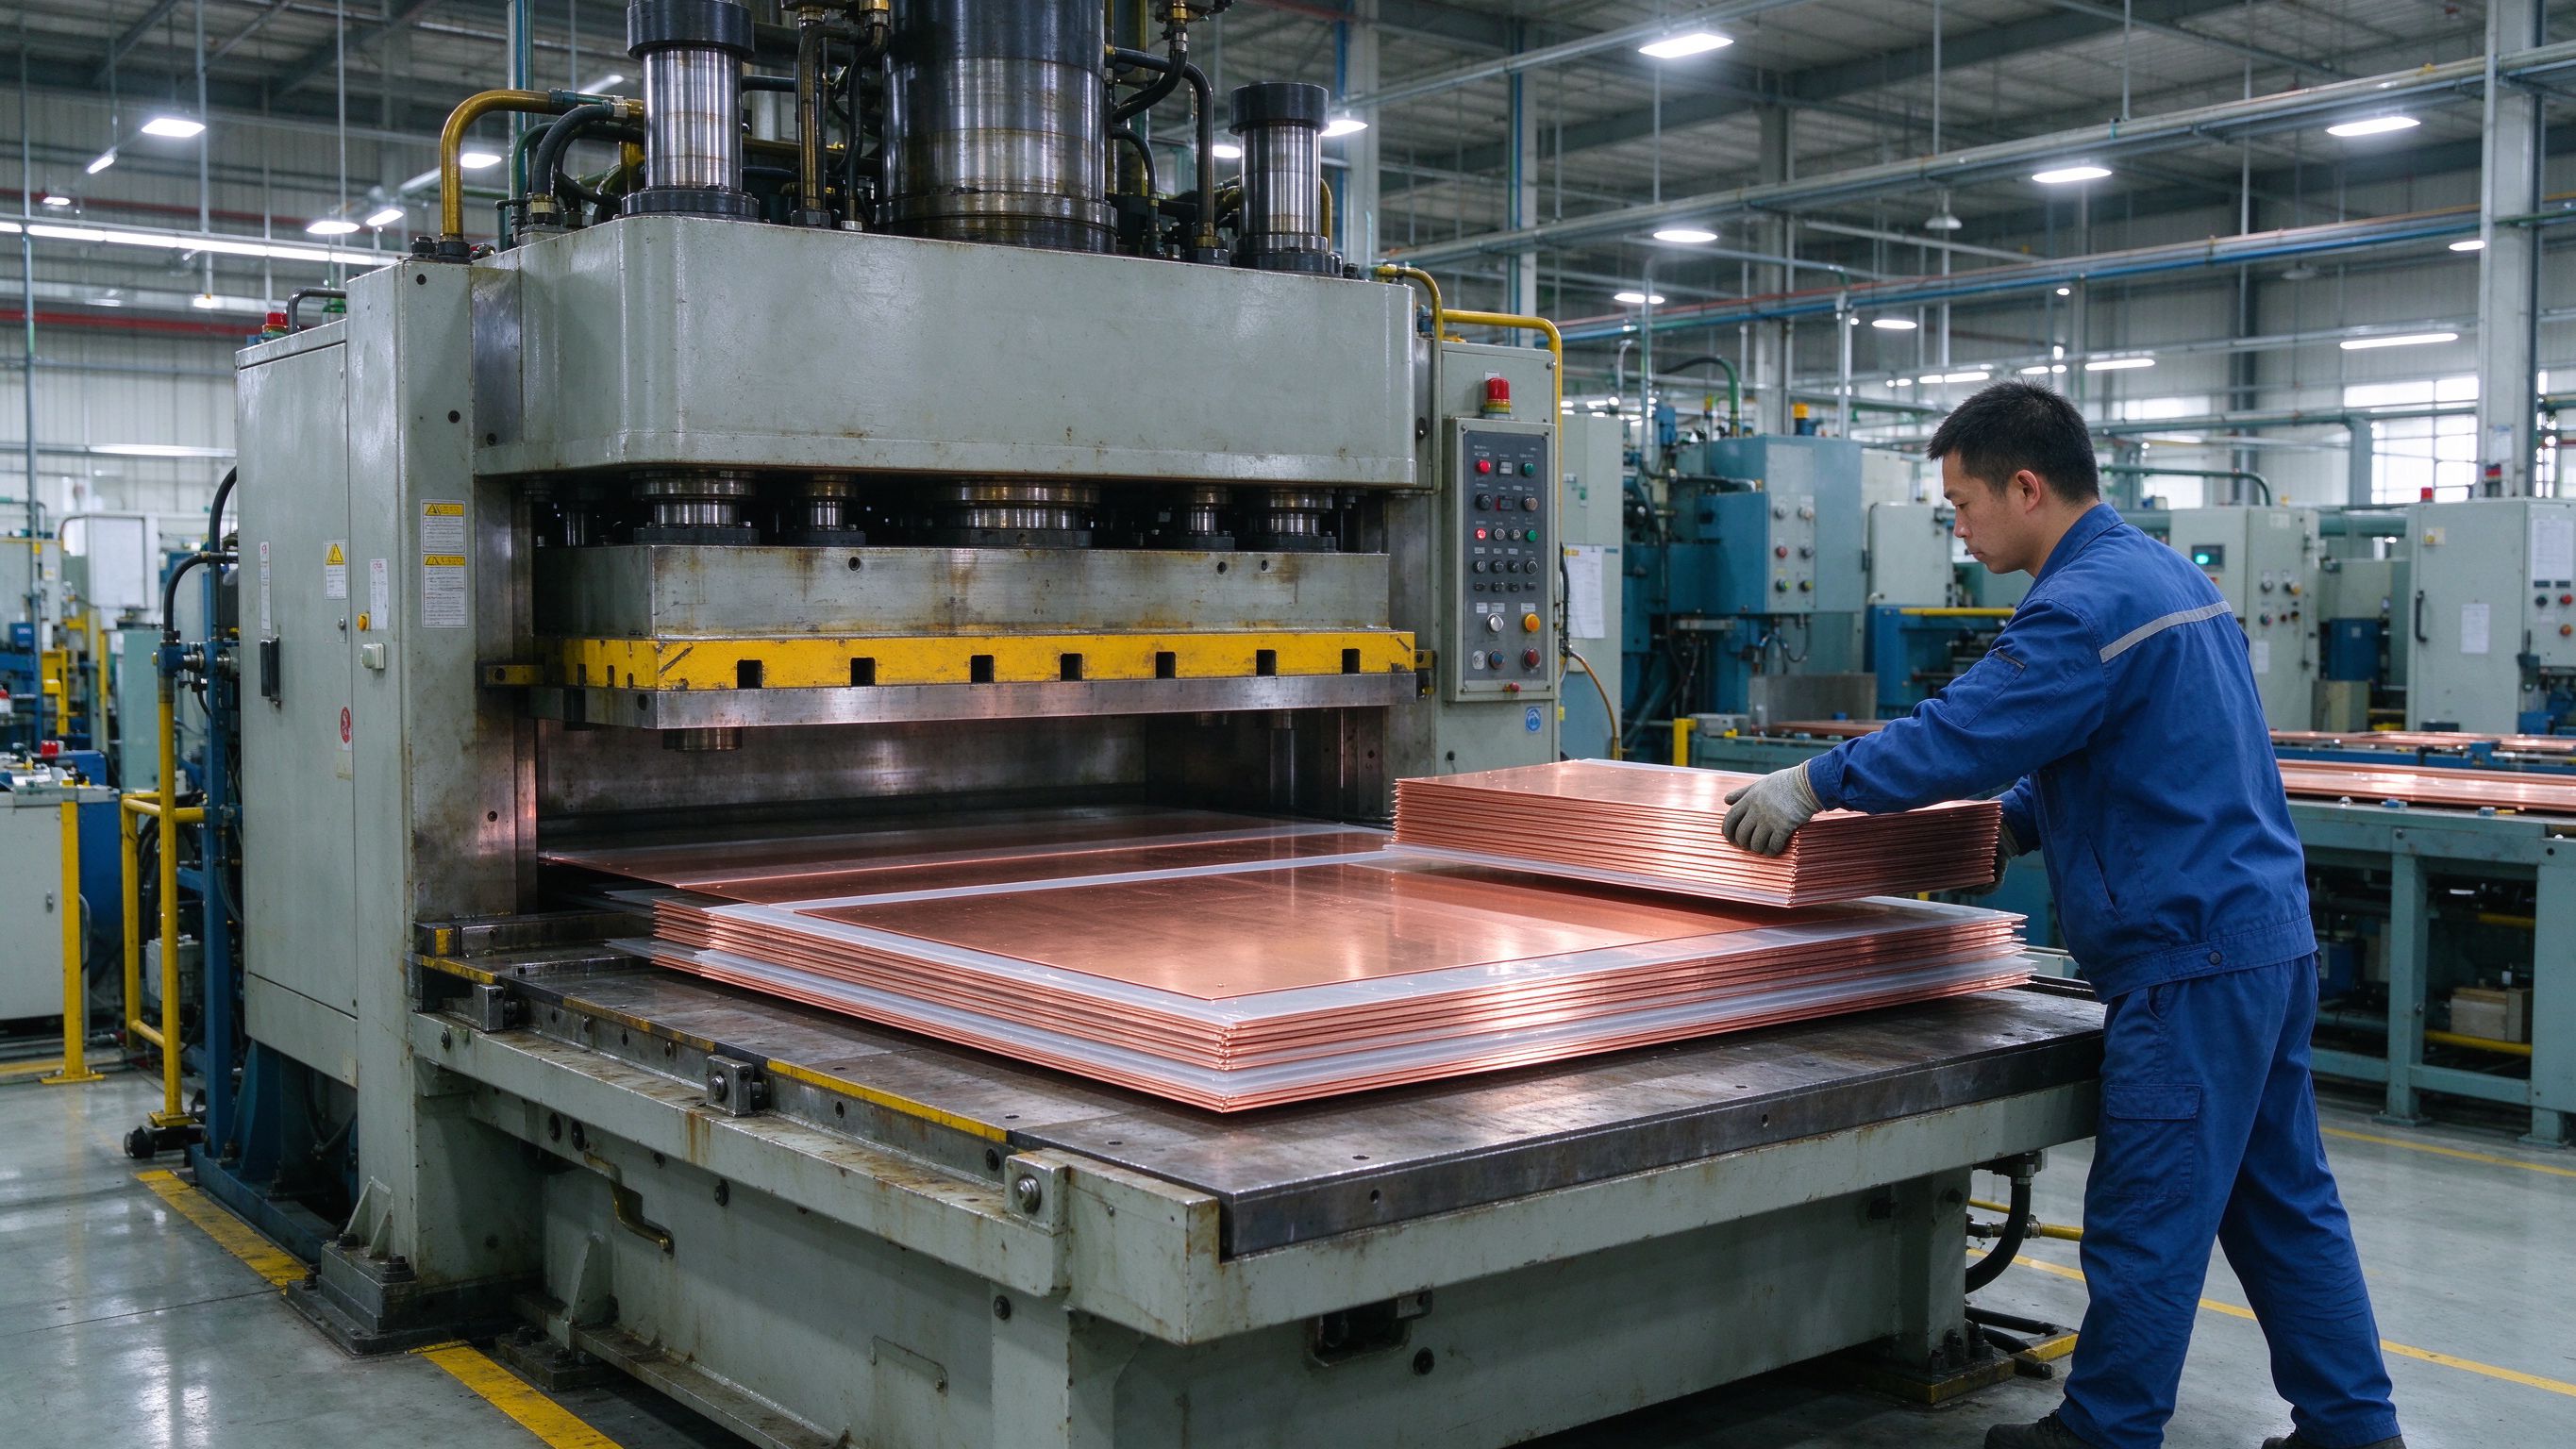
Above a few hundred amps in a confined enclosure, the busbar is never the only item on the thermal bill of materials. The conductor’s temperature rise is bounded partly by the cooling its surroundings provide, so the bar, the power modules and the heat-removal hardware are co-designed rather than sized separately. Reference data makes the point plainly: a high-current clip interface rated 400 A maximum drops to about 240 A at a 30 °C rise, and blind-mate contact families run 175–265 A at the same 30 °C reference — the derating is set by junction temperature, not by copper area alone.
The cooling hardware options that pair with high-current assemblies form a familiar ladder:
The rule of thumb we apply in DFM review is simple: once continuous ratings exceed roughly 200 A inside a sealed volume, treat the busbar and its cooling as one design problem. The laminate itself already helps — a flat stack presents a large radiative and convective surface, and a film-laminated outer surface reaches an emissivity near 0.9 against roughly 0.03 for bare polished copper. But natural convection rarely settles the question at the highest densities, and forced air — then liquid cooling — becomes the margin that lets the same copper carry more current.
How that trade-off is computed, with derating for ambient, bundling and enclosure, is worked through in the busbar ampacity chart, and the loss side of the equation — loop inductance and switching losses the sink must also absorb — is covered in low-inductance busbar design. The same co-design pattern is routine in inverter and UPS busbars, where the DC-link bar, the power stage and the cold plate are released as one package.
Send the current profile, voltage class and installation conditions — we will size the busbar and document the calculation with your quotation.
Send the current profile, voltage class and installation conditions — we will size the busbar and document the calculation.