A 400 MW AI campus facing a five-to-seven-year interconnection wait cannot hold its build schedule against the queue. Bridge power — on-site gas turbines or reciprocating engines feeding MV switchgear — carries base load until the utility feeder arrives, and the conductors between those machines carry duties conventional data center busbars rarely see: parallel-source circulation, combined fault currents, repeated 10–50 MW load steps and a later reuse phase after grid handover. IEA, LBNL/DOE and EPRI outlooks published in 2025–2026 quantify the demand side, while PJM and ERCOT queue figures set the waiting window. This article traces the plant from generator breaker to rack feed and maps what each duty asks of the busbar.
A 400 MW AI campus facing a five-to-seven-year interconnection wait cannot hold its build schedule against the queue. Bridge power — on-site gas turbines or reciprocating engines feeding MV switchgear — carries base load until the utility feeder arrives, and the conductors between those machines carry duties conventional data center busbars rarely see: parallel-source circulation, combined fault currents, repeated 10–50 MW load steps and a later reuse phase after grid handover. IEA, LBNL/DOE and EPRI outlooks published in 2025–2026 quantify the demand side, while PJM and ERCOT queue figures set the waiting window. This article traces the plant from generator breaker to rack feed and maps what each duty asks of the busbar.
This page is an annual rolling data page: the 2026 edition, refreshed once a year as new market data is published.
A 400 MW AI campus that cannot secure grid energization for five to seven years has two choices: break ground on a date that slips with the queue, or start the plant on its own generation and accept the utility connection later. The second path is what the industry now calls bridge power — on-site gas turbines or reciprocating engine-generators, feeding medium-voltage switchgear, that carry the full IT and cooling load through the interconnection waiting period.
It is not a standby UPS covering a five-minute outage, and it is not a battery string riding through a voltage dip. Bridge plants are rated to carry continuous base load for months, in some cases several years, before the utility feeder arrives. The conductors between those machines carry duties a conventional data center does not see: parallel-source circulation, repeated 10–50 MW load ramps, and a bus that outlives its first operating phase and must be reused after the grid connection lands.
This review follows the engineering sequence of parallel units — busbar — step load: circulating current and load sharing, short-circuit withstand and electrodynamic forces, thermal stability under step loads, N+1 and bus-tie switching, and the retrofit questions when bridge generation gives way to utility supply.
The shift to bridge power rests on a measurable gap between AI deployment speed and grid interconnection speed. Three public outlooks set the demand side; two operator queues set the waiting side.
On demand, the IEA Energy and AI outlook (2025/2026) projects global data centre electricity rising from roughly 485 TWh in 2025 to about 950 TWh in 2030, around 3% of global demand, with AI-focused load tripling over the period. The LBNL/U.S. DOE Data Center Energy Usage Report, 2025 Update (published 2026) puts the U.S. reference case at 464 TWh in 2028. EPRI's Powering Intelligence scenarios (February 2026) estimate data centres consuming 9% to 17% of U.S. electricity by 2030, up from 4% to 5% today.
On supply, the PJM large-load queue tracked in mid-2026 sits around 55,000 MW, with typical waits of 36–48 months and some past five years; Northern Virginia waits for a 100 MW-plus connection run close to seven years. In ERCOT, large-load requests reached roughly 410 GW in 2026, about 87% from data centres, with loads above 75 MW facing three to four year waits outside the earliest batch. Those periods are the window bridge generation fills.
| Reference | Figure (year) | What it drives |
|---|---|---|
| IEA Energy and AI, 2025/2026 | 485 TWh (2025) to 950 TWh (2030) worldwide | Scale of campus build-out behind queue demand |
| LBNL / U.S. DOE 2025 Update, 2026 | 464 TWh U.S. reference case, 2028 | U.S. load concentration and site selection |
| EPRI Powering Intelligence, Feb 2026 | 9–17% of U.S. electricity by 2030 | Peak-load and fault-duty growth assumptions |
| PJM large-load queue, mid-2026 | ~55,000 MW; waits 36 months to ~7 years | Bridge plant operating life before handover |
| ERCOT queue, 2026 | ~410 GW; ~87% data centres; 3–4 year waits | Duration and redundancy of bridge duty |
A typical bridge campus sits in three voltage bands. At the source, reciprocating engine-generators in the 2–15 MW class or gas turbines in the 15–60 MW class produce power at generator terminals, usually 13.8 kV or 4160 V. Each unit exits through its own generator breaker onto a common medium-voltage main bus. That main bus is sectioned, with bus-tie breakers between sections, and feeds auxiliary transformers stepping down to 480 V or 690 V for switchgear, UPS plants and converter rooms.
Between generator breakers and step-down transformers, the busbar has three jobs: collect output from every parallel unit onto one low-impedance path, isolate any unit or feeder for maintenance without dropping the campus, and carry fault current long enough for protection to clear it. Downstream 480/690 V distribution uses bolted or laminated low-voltage switchgear busbars feeding UPS input panels, static transfer switches and converter DC links.
Engineers often dimension conductors from the IT load at the rack. In a bridge plant the binding constraints sit upstream: the parallel generator bus must handle circulating current between machines, the main bus must survive the largest three-phase fault with all units online, and every section must remain rated for the bus-tie closed configuration, when one section carries the entire campus load. Conductors sized only from steady IT amperage underdesign those duties.
Tracing one engine to a feeder makes the conductor roles explicit. Generator terminals connect through flexible connections and the generator breaker to a compartment bus; compartment buses tie into the main MV bus by section; the main bus feeds outgoing feeder breakers to auxiliary transformers or large cooling motors. On the low-voltage side, switchgear busbars distribute between incoming breakers, bus-tie breakers and feeder panels. The power distribution sequence repeats at each level: source bus, tie bus, feeder bus, with rating defined by continuous current, short-time withstand and insulation coordination.
Several bus shapes appear in parallel plants. Rigid copper or aluminum rectangular bar is standard in MV and LV switchgear, bolted between insulator supports; laminated insulated busbars appear at converter links, inverter DC stages and UPS internal assemblies, where low inductance and phase-to-phase insulation matter more than bracing to a cabinet wall; flexible braided or laminated connectors bridge the small movement between generator frame and stationary bus.
Geometry matters for sharing. Two identical units feeding the main bus through unequal bus lengths create unequal impedance paths, and the bus itself becomes part of the parallel circuit. Equalized feeder lengths, symmetric phase spacing and balanced support layouts reduce the mismatch that pushes current toward one machine. Bar cross-section and contact resistance set the steady temperature baseline that later sections measure against.
When several generators run on one bus, no two machines are perfectly identical. Small differences in no-load voltage, internal impedance, governor response and busbar-path impedance drive current that circulates between machines without reaching the load. That current does no useful work, but it heats windings, breakers and busbar joints and reduces headroom for real load. In a multi-unit campus this effect accumulates: twenty units mean twenty parallel impedance paths, and busbar asymmetry compounds machine mismatch.
Two control strategies govern sharing. Droop control lets each unit adjust speed and voltage proportionally to its load; units with slightly higher output take a larger share, trading small frequency and voltage changes against even loading. Isochronous and equal-power control hold tight bus frequency and force matched kilowatt and kilovolt-ampere sharing, relying on fast load-sharing controls and matched regulators. Droop is simpler and stable across many units; equal-power control protects weaker machines but depends on sensing qualified alongside the power hardware.
| Strategy | Sharing behavior | Busbar implication |
|---|---|---|
| Droop speed / voltage | Units share roughly by rating; mild frequency and voltage trade-off | Design bus for worst-case unit share plus circulating component |
| Isochronous speed, equal kW | Tight frequency; load matched across units | Balanced bus impedance keeps share equal between machines |
| Equal kVAR / reactive sharing | Voltage regulators match reactive output | Phase spacing and bar impedance limit reactive circulation |
The busbar designer cannot fix a control problem, but can remove impedance as a variable: equal-length connections, symmetric phase arrangements, identical tap locations and low-resistance plated joints keep paths balanced. Conductors are rated for full generator current plus the circulating component the scheme allows, not campus load divided by unit count. Unit-breaker-to-main-bus joints deserve attention, because that is where circulating current concentrates first and where contact heating shows up in infrared inspection.
The worst-case fault in a bridge plant is a bolted three-phase short on the main bus with every generator online. Each machine contributes its subtransient reactance current into that fault, and the common busbar carries the combined peak until protection clears. Fault duties in large campus plants reach several tens of kiloamperes peak, and the rating must derive from all sources online — engines, turbines, any co-located storage and the utility once synchronized — not from one generator alone.
Two conductor stresses result. Thermal stress is the I²t heating during the fault, raising bar and joint temperature until the breaker opens; it must stay within material and insulation limits for the short-time rating. Electrodynamic stress is the force between phases during peak asymmetric current, proportional to the square of peak current and inversely to phase spacing. That force acts on the bar, insulator supports and mounting structure, and support spacing is chosen so the bar does not buckle or the insulator crack under the peak.
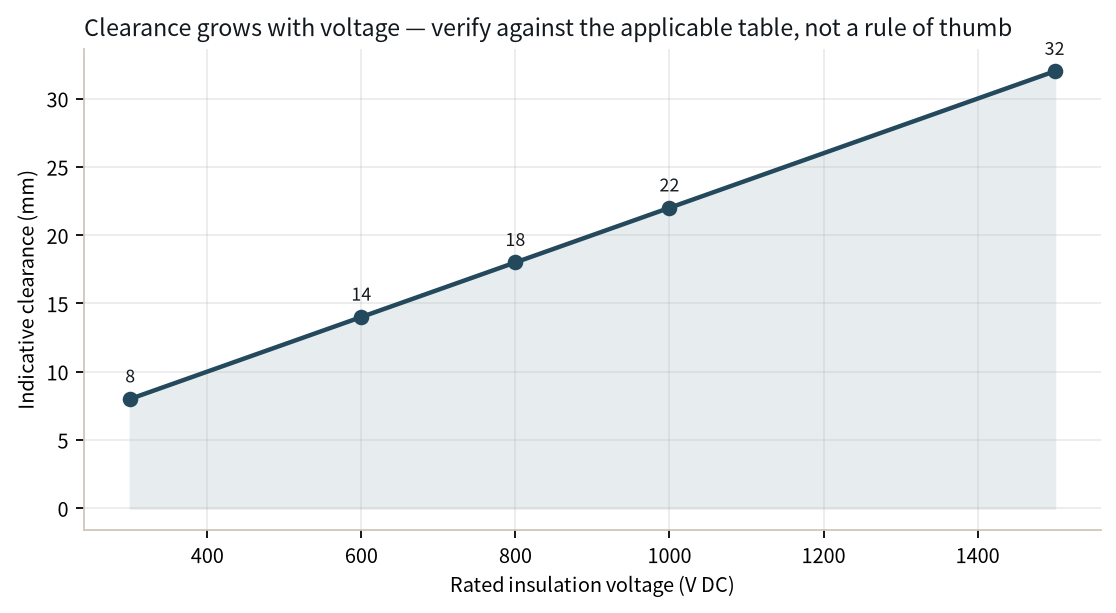
At 13.8 kV and 4160 V, phase-to-phase and phase-to-ground clearance, creepage along insulator surfaces and the insulation class of any coated or laminated section follow the applicable switchgear and busbar standards, with pollution and humidity ratings chosen for the site climate. A bus moved from a smaller engine block to a larger parallel array must be re-evaluated for fault duty; a bar that survived a 25 kA plant does not automatically survive a 65 kA plant.
AI campuses do not load smoothly. Rack rows power up in batches, cooling plants start on sequence, and one event can add 10 to 50 MW across the bus within seconds. Under a step, governors and AVRs respond over hundreds of milliseconds: frequency dips as energy leaves rotating inertia, voltage sags as reactive current follows, and protection and UPS systems ride through the transient. The busbar sees this as a repeated pulse train, not a steady current, and its thermal design follows the duty cycle rather than the average.
The immediate dip and frequency excursion are controlled by machine inertia, excitation and controls; the conductor's job is to carry the transient current without exceeding temperature limits. A step raises current through the bar and every joint, and repeated ramps keep cycling the temperature up and down. Joint resistance dominates long-term heating: a slightly resistive bolted or plated connection heats more under each pulse, and heating relaxes clamping pressure, which raises resistance further. Terminal temperature trends are the early warning for loose or oxidized connections.
Thermal stability is checked against the actual ramp profile: peak current per step, recovery time between steps, daily step count and bus-room ambient. The thermal management review covers ventilation, enclosure derating, surface finish and whether the bar can shed heat between ramps. Converter-facing busbars feeding UPS and inverter stages also carry harmonic current that adds skin- and proximity-effect heating steady RMS figures do not capture.
Bridge plants are specified with redundancy because losing a single engine or feeder must not drop the IT load. The common scheme is N+1: one extra unit beyond steady requirement, and a main bus split into two or more sections connected by bus-tie breakers. Each section carries a share of the campus; a generator fault trips its breaker and isolates its section; the tie breaker can close to reconnect sections, carrying combined load through the remaining healthy bus.
This topology changes the busbar rating in two states. In the normal split state, each section carries its own load. In the tie-closed state after a loss, one section's bus and feeder breakers carry the whole campus through the tie path. The bus, supports and joints in that section must be rated for tie-closed current, not the split-state average, and protection interlock must prevent closing the tie onto a faulted section. The tie connection itself is a critical joint: it carries full plant current during contingency and sees repeated make-and-break duty.
Redundancy also applies to routing. Feeder busbars to UPS plants run in diverse paths so a tray or bus duct fire does not take out both feeds, and spare tap positions on the main bus allow later feeders without rebuilding the run. For an AI campus power architecture, the redundancy map drawn at switchgear level should extend down to laminated busbars inside converter and UPS assemblies, where one failed joint can remove an entire redundant path.
Continuous bridge operation pushes busbar temperature design past the simple ampacity table. The reference baseline uses a 30 °C rise over a 40 °C ambient for copper, but bridge rooms often run hot from engine exhaust ducting, inverter heat and restricted ventilation, and derating factors apply for ambient, enclosure and grouping. Bar cross-section, contact resistance, plating and surface condition set the steady rise; the step-load cycle adds transient excursions on top of that baseline.
Insulation selection follows voltage and environment. PET films, Nomex paper and DLF dielectric systems are common in laminated insulated busbars, chosen for temperature class, dielectric strength and resistance to humidity and contamination. Tin plating on copper terminals protects against oxidation at bolted joints and keeps contact resistance stable over years of thermal cycling. Terminals use M6 or M8 studs, blade tabs or welded interfaces matched to the breaker or converter connection.
Ventilation and bus-room layout are part of the electrical design: blocked airflow raises bar temperature across an entire section, and hot air near top-mounted joints accelerates insulation aging. Commissioning measurements should capture bar and joint temperatures under real campus loading, not only at no load.
The bridge period ends when the utility feeder completes interconnection. The plant synchronizes bridge sources with the grid, reduces engine output, and transfers load to the feeder; engines then become standby or peaking capacity, or leave site. The conductors installed for bridge duty do not disappear at that moment, and whether they can be reused downstream is a procurement and engineering question worth answering before the first busbar is ordered.
Low-voltage switchgear busbars, converter DC links and UPS feeder busbars typically carry over into grid-connected operation unchanged: their duty under utility supply is a subset of the bridge duty they were designed for. The MV main bus faces a different check. Once the utility feeder is online, fault duty rises with the grid contribution, and the original bridge-plant withstand rating may no longer match the new system fault level. Reuse needs a fresh short-circuit study, an insulation and joint inspection record, and confirmation that support bracing meets the new peak force.
Retrofit after handover commonly adds feeder taps for new rows, re-rates a section for lower utilization, replaces aged insulation at high-heat joints, or splits the main bus to match the utility switching arrangement. A BESS augmentation and repowering review shows the same pattern: conductors survive the hardware change, but their rating has to be re-proven against the new source mix. Busbars with conservative headroom, documented joint torques and inspectable terminals reuse more easily than custom one-off assemblies with hidden connections.
Bridge plants mix rigid switchgear busbar with laminated power-electronics busbar, and material choices follow the role. Rigid busbars use C11000 copper for high conductivity and mechanical strength, or aluminum where weight and cost drive the choice; copper remains the default at joints subject to repeated cycling, because its softer surface conforms under clamp pressure and its tin-plated interface resists oxidation. Laminated insulated assemblies stack conductor and dielectric from one to six or more layers, rated around 1000 A in typical power-electronics duties, with interleaved phases keeping loop inductance low for converter and inverter stages.
Construction details that matter in a parallel-generator plant include the terminal interface: stud, blade or weld connections sized to the breaker lug or converter terminal, plated contact faces, and bend radii that keep copper from work-hardening at the bend. Layer count and dielectric thickness follow system voltage and creepage needs, and the assembly passes dielectric withstand test before shop shipment.
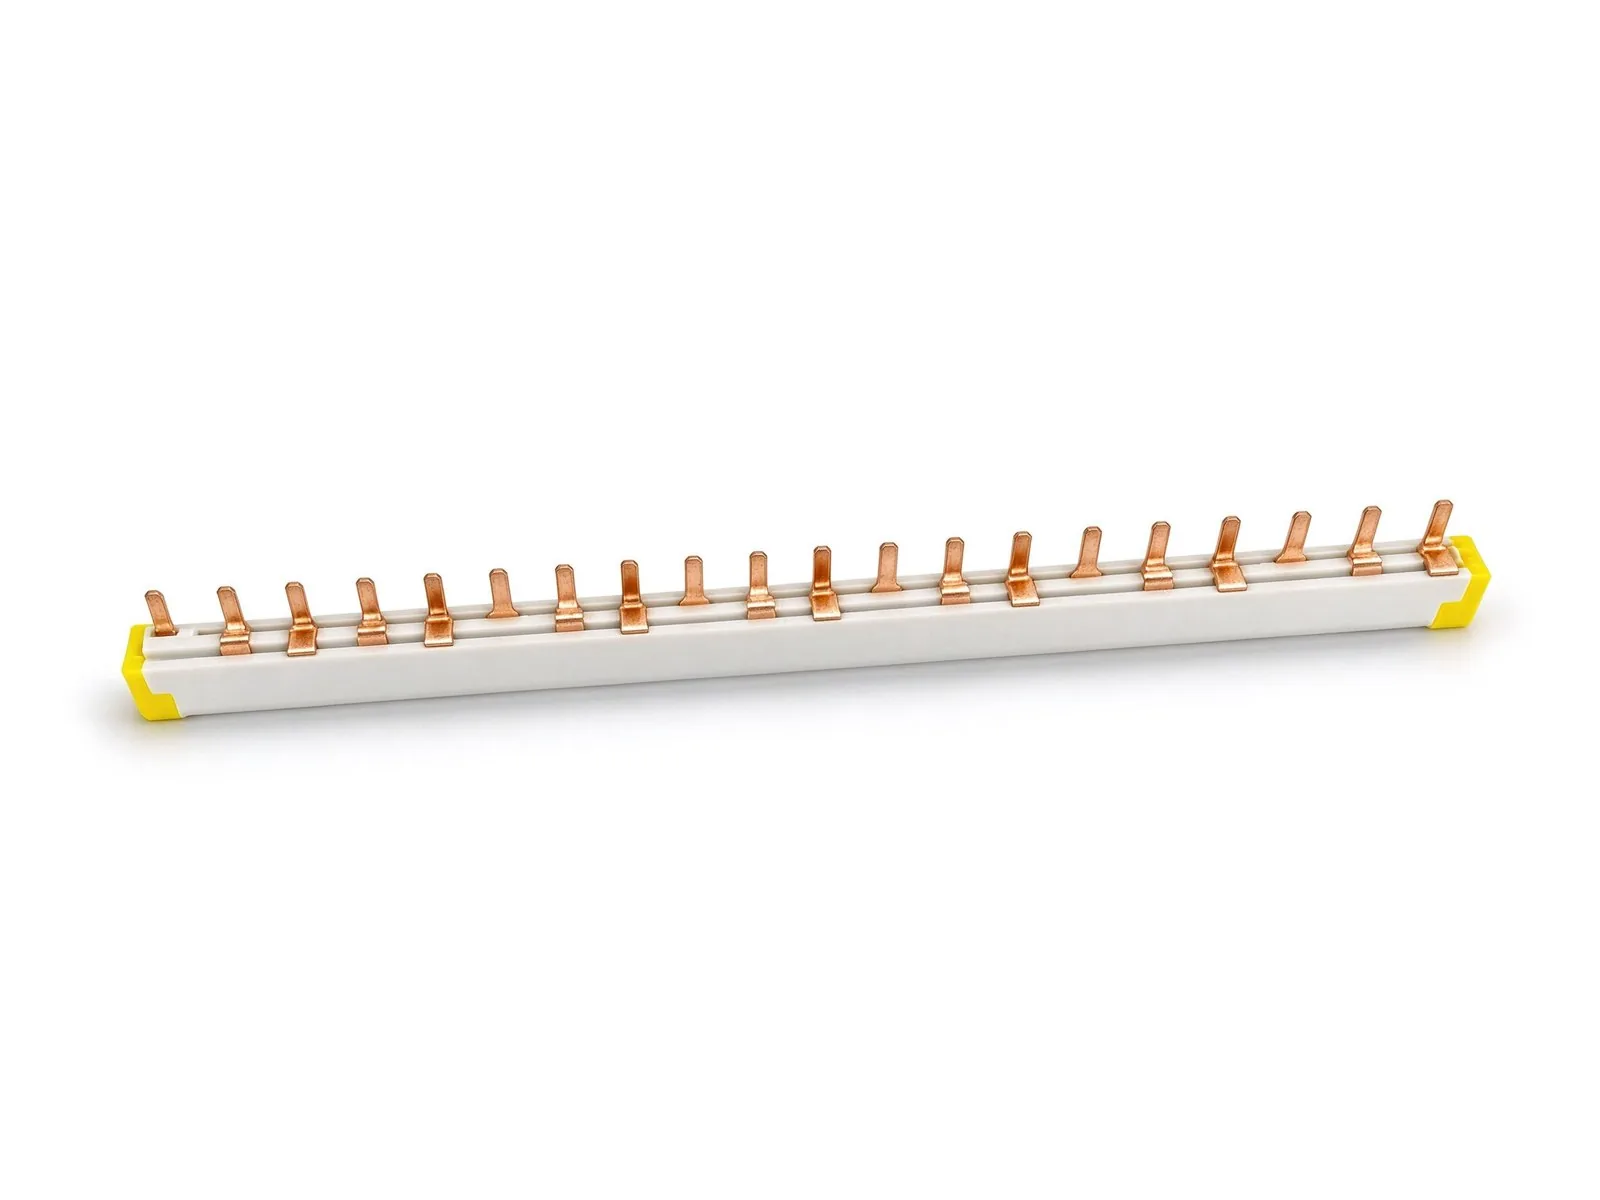
Buyers comparing multi-layer laminated busbar assemblies should ask for layer count, dielectric type, plating, terminal configuration and rated rise alongside nominal ampacity.
For the switchgear side, rigid bar length, insulator count and bus duct routing are set during layout; later field changes to routing cost far more than drawing-stage adjustments. Standard laminated busbar product lines cover converter, inverter and DC-link duties, while custom configurations are quoted from the electrical drawing, terminal positions and thermal target. None of this substitutes for the site-specific fault-duty and sharing study described earlier.
Switchgear, generators and busbars share the 2026 equipment crunch: transformers, breakers and insulated bus assemblies carry long lead times, and bridge plants are already compressed by the queue they are trying to beat. Procurement sequencing starts with the source study — load profile, fault duty, sharing analysis and redundancy scheme — because those outputs fix bar rating, terminal layout and insulation class before any supplier can quote. Ordering conductors before the study freezes design assumptions that later prove optimistic.
A second source is part of risk management for any multi-year bridge project. Qualifying a second busbar supplier early means sharing drawings, electrical ratings and test requirements, and running sample-to-series validation so a replacement batch matches the original joint geometry and material. The second-source requalification walkthrough covers what documentation to keep, which dimensions are tolerance-critical, and how to verify a follow-up batch meets the same rise, resistance and dielectric targets. That record protects later reuse and expansion phases as well as day-one build-out.
The commissioning file should include as-built busbar ratings, joint torque records, insulation test results, thermal baseline readings and the source-study inputs that justified the rating. That file makes the post-grid handover reuse check fast: retrofit engineers compare measured joints against the original baseline instead of re-testing every connection from scratch.
For a campus team evaluating bridge power, conductor decisions line up with the source study in this order:
Busbar design for bridge power is closer to switchgear engineering than to the cable-sized building block most procurement teams assume. Parallel-source circulation, combined fault duty and a multi-phase operating life each push rating decisions a steady load calculation misses. SHANYUAN supplies insulated laminated busbars, switchgear busbar assemblies and custom conductor layouts for converter, inverter and switchgear duties, working from the electrical drawing, terminal positions and thermal target. If a team is mapping bridge generation, MV switchgear or a later grid handover, the review can start with the load profile and fault-duty study before conductor sizes are fixed — contact the engineering team with the single-line diagram and step-load profile to begin.
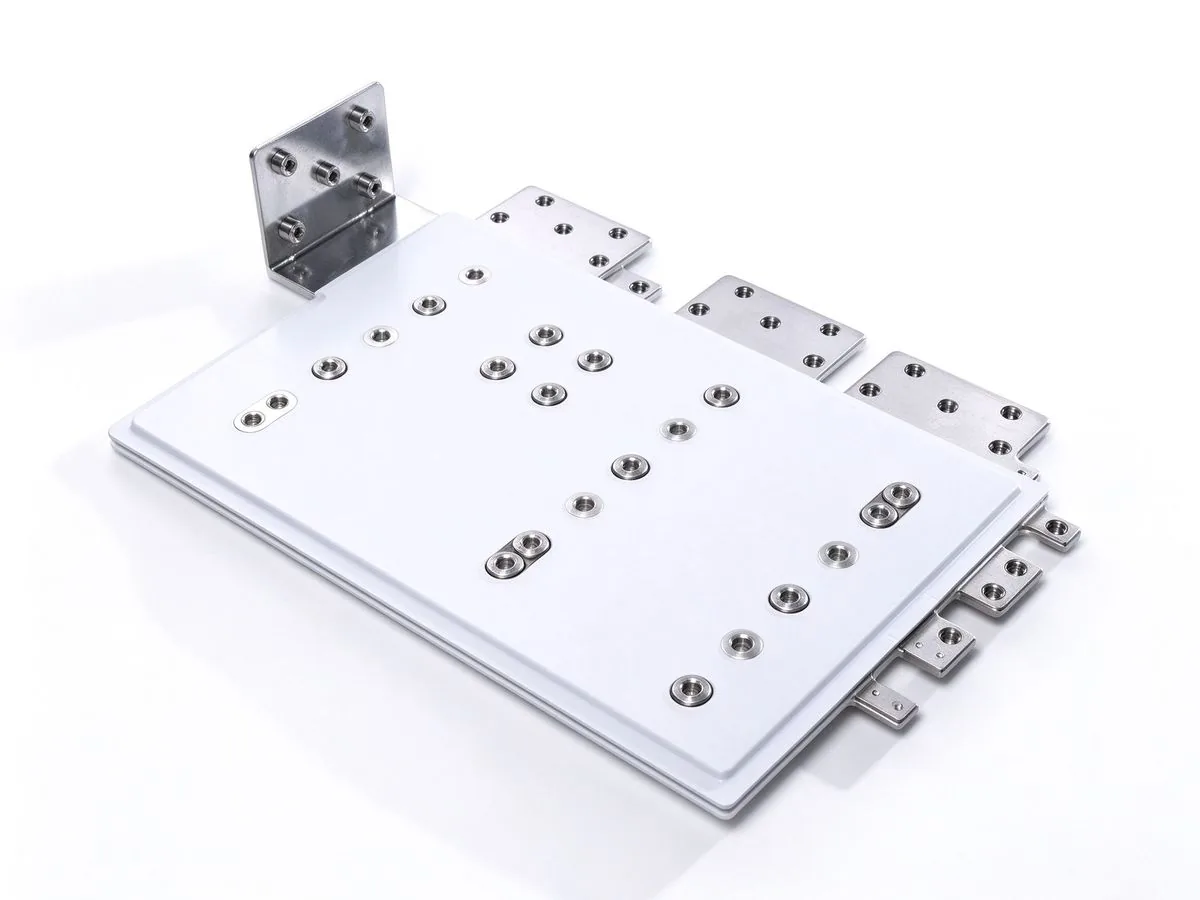
Green power direct connect — matching renewables and storage directly to compute and indus
Read article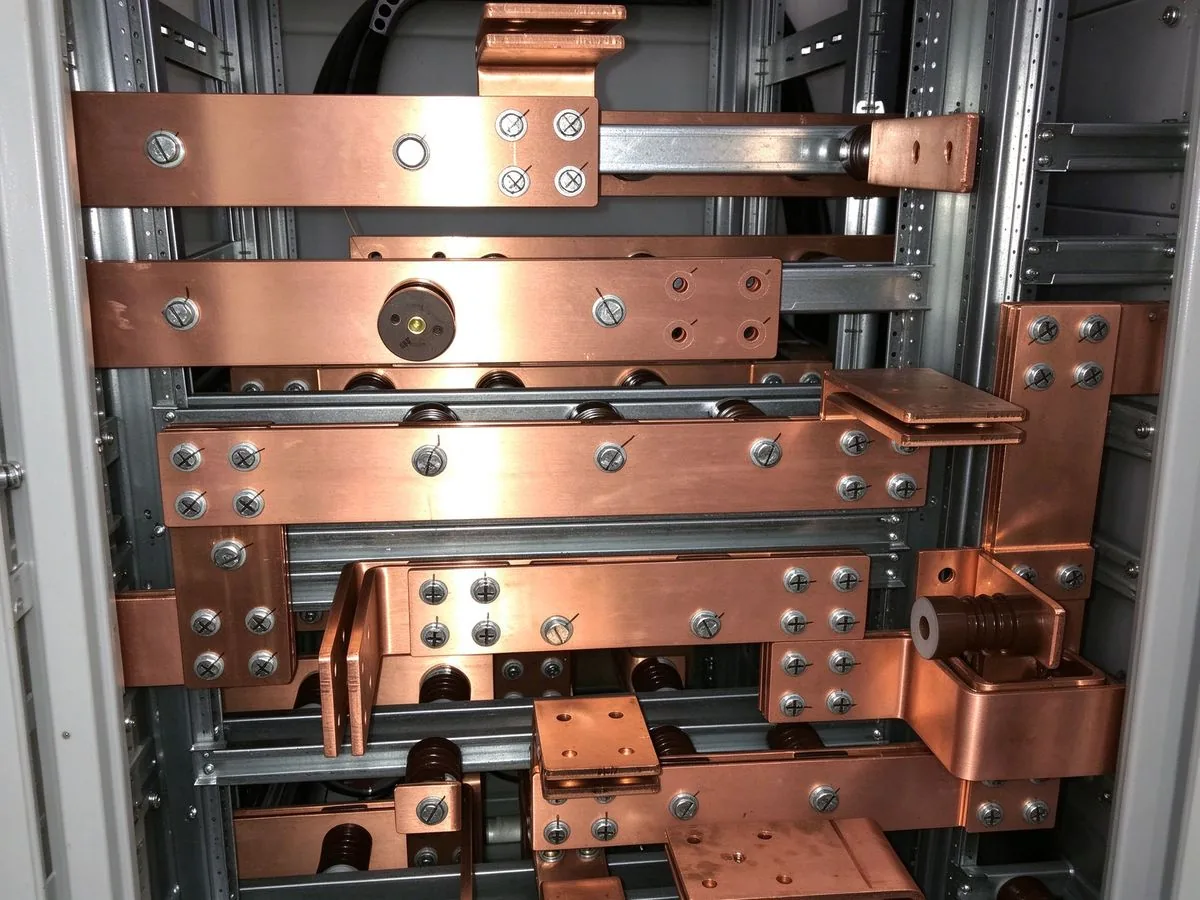
Standard power transformers average about 128 weeks to delivery and generator step-up unit
Read article
Daniel Richter is the chief electrical engineer at SHANYUAN Laminated Busbars, with 15 years in laminated busbar design and current-carrying systems. He leads electrical dimensioning, DC-link layout and thermal simulation for power converters, EV platforms and HVDC stations, and holds an M.Sc. in El
Send the current profile, voltage class and terminal types — our engineers reply within one business day.