Every busbar is a resistor. At 1000 A, a single milliohm of resistance drops 1 V and wastes 1 kW of heat. Voltage drop and I²R loss are two views of the same physics, and both are fully under the designer's control — if the calculation is done before the drawing is frozen.
Every busbar is a resistor. At 1000 A, a single milliohm of resistance drops 1 V and wastes 1 kW of heat. Voltage drop and I²R loss are two views of the same physics, and both are fully under the designer's control — if the calculation is done before the drawing is frozen.
Contactors drop out below their pick-up voltage; drives fault on undervoltage; charging systems derate at low bus voltage. The voltage at the load is the bus voltage minus every drop in the path — busbar, terminations, cable, connector.
For long distribution runs and high-current links, the busbar drop is often the largest controllable term in that chain.
The DC resistance of a busbar is R = ρ · L / A, where ρ is resistivity (Ω·m), L is length (m) and A is cross-section (m²). For C11000 ETP copper, ρ is about 1.72 × 10⁻⁸ Ω·m at 20 °C.
Voltage drop follows Ohm's law: ΔV = I · R. Power loss is P = I² · R. Both scale linearly with resistance — which scales with length and inversely with cross-section.
Copper's temperature coefficient is about +0.00393 per K. A busbar at 100 °C carries roughly 1.3× the resistance it had at 20 °C.
Designers should compute resistance at the operating temperature, not at 20 °C. The temperature-rise target (for example 30 K above 40 °C ambient) plus the ambient define the working point.
Take a 100 mm × 10 mm C11000 busbar, 1 m long. Cross-section A = 0.1 × 0.01 = 1 × 10⁻³ m². Resistance at 20 °C = 1.72 × 10⁻⁸ × 1 / 0.001 = 17.2 µΩ. At 90 °C (70 K rise), R ≈ 17.2 × (1 + 0.00393 × 70) = 21.9 µΩ.
Voltage drop at 1000 A: ΔV = 1000 × 21.9 × 10⁻⁶ = 0.0219 V (about 0.02% of a 1000 VDC bus). Power loss: P = 1000² × 21.9 × 10⁻⁶ = 21.9 W per metre.
That sounds small — until the same busbar runs at 4000 A in a fast-charge application: ΔV = 87.6 mV and P = 350 W per metre.
There is a second temperature effect designers forget: the busbar heats the surrounding air, which heats the neighbouring components, which raises their resistance and their losses. In a dense cabinet, the busbar's heat contribution to the enclosure thermal budget is part of the system calculation, not an isolated figure.
21.9 W per metre at 1000 A is 192 kWh per metre per year, continuous. At industrial electricity prices around USD 0.10-0.15/kWh, that is USD 19-29 per metre per year in lost energy — before counting the air-conditioning load to remove the heat.
Doubling the cross-section halves both the drop and the loss for a one-time copper cost that usually pays back in months at high duty cycles.
The formulas above are DC. In AC and switching applications, skin effect and proximity effect raise effective resistance: at 50 Hz the copper skin depth is about 9.4 mm, so a 10 mm bar is barely affected; at 20 kHz it is 0.47 mm, and the effective AC resistance of a thick bar can be several times the DC value.
For switching-frequency links, the answer is thin laminated layers rather than one thick bar — the same logic that makes laminated DC-link busbars standard in SiC inverters.
Bolted terminations add 10-50 µΩ per joint depending on plating, clamping force and surface condition. A poor joint can dominate the busbar's own resistance.
Tin plating, controlled torque and Belleville washers keep contact resistance low and stable. Include terminations in the drop budget — they are the most variable term in the calculation.
Three levers control drop and loss: cross-section (halve both by doubling A), length (shortest path wins), and material (copper vs aluminium: aluminium needs ~1.6× the cross-section for equal resistance at ~50% of the weight and lower material cost at 2026 price ratios).
In practice, geometry constraints (clearance, bend radii, weight) and cost decide the lever to pull. The calculation tells you which one matters.
Contact resistance is also current-dependent in a subtle way: higher clamping force lowers resistance until the copper starts to yield, after which further torque adds little. The practical rule is to specify torque values that put the joint in the flat part of the force-resistance curve, which is where Belleville washers earn their place.
A busbar must satisfy two independent checks: temperature rise (thermal budget, roughly I²R against cooling) and voltage drop (electrical budget, IR against system tolerance). Either can be the binding constraint.
Short, high-current links are usually thermal-limited; long, low-current runs are usually drop-limited. Designers who only check one get surprised by the other.
Start with the ampacity table (30 °C rise reference), then run the drop and loss calculation at the operating temperature. Spreadsheet formulas are enough for straight runs; FEM is reserved for complex geometries and switching-frequency AC resistance.
SHANYUAN provides design tables and calculation support with every RFQ — send the drawing and the duty cycle, and we return the drop and loss figures with the quote.
A 48 VDC rack busbar carrying 2000 A over 0.8 m: A = 0.12 × 0.01 = 1.2 × 10⁻³ m²; R(20 °C) = 1.72 × 10⁻⁸ × 0.8 / 0.0012 = 11.5 µΩ; at 90 °C ≈ 14.6 µΩ. Drop = 29.2 mV, loss = 58.4 W.
At 48 V, 29 mV is 0.06% of the bus — but every millivolt counts when the rack electronics spec a tight input window, and the 58 W of heat sits inside a sealed cabinet that already struggles with airflow.
The ampacity table and the drop calculation should agree with each other. A bar that passes the temperature-rise check at 1500 A but drops 3 V across a long run may still fail the system's voltage window — the two checks protect different things and both belong in the spec.
State the maximum acceptable voltage drop at rated current, or the maximum loss in watts, in the RFQ. Suppliers then size the busbar against your thermal and electrical budgets instead of guessing.
Both numbers belong in the electrical parameter table alongside current, temperature rise and fault current.
An important nuance for 48 V systems: a 0.1% drop is 48 mV, which sounds trivial, but rack electronics with tight input windows derate or fault below a threshold, and the drop adds to every other drop in the chain. Low-voltage, high-current distribution is where milliohms matter most.
The frequent errors: using 20 °C resistivity at operating temperature, ignoring termination resistance, treating AC runs as DC, and confusing peak current with continuous current in the loss calculation.
Each one understates the real drop or loss by a measurable factor — which is exactly what shows up as a field surprise.
Voltage drop and I²R loss are the two numbers that connect busbar geometry to system performance and operating cost. Both are calculable before the drawing is frozen, and both are cheap to fix at design stage.
Send SHANYUAN the duty cycle and envelope; we return the drop, loss and temperature-rise figures with the quotation.
And a final rule for specification writers: put the drop and loss numbers in the RFQ in the same sentence as the current rating. Suppliers respond to explicit budgets; a drawing with only '1000 A' leaves the drop to interpretation, and interpretation is where field surprises come from.
Voltage drop becomes the binding constraint when the busbar run is long. Take a 2000 A DC bus in a battery plant running 6 m between the converter and the rack feeder: a 120 × 10 mm bar has R(90 °C) ≈ 1.72×10⁻⁸×6/(0.0012)×1.275 ≈ 110 µΩ, dropping 219 mV at 2000 A and losing 438 W.
Doubling the bar to 240 × 10 mm halves both numbers: 110 mV drop and 219 W loss, at the cost of extra copper and cabinet width.
Whether the doubling is worth it depends on the system's voltage tolerance and the energy price — the calculation, not the habit, should decide.
On the installed busbar, measure drop with a four-wire milliohm measurement across the section of interest, at the operating current if possible. Compare the measured value to the calculated budget; a large gap usually points to terminations rather than the bar itself.
Thermal imaging at rated load is the fastest field check for hot joints and uneven current distribution across parallel bars.
Include the measurement method in the acceptance test plan so that field data matches the design numbers — otherwise the drop budget exists only on paper.
The operating cost of busbar losses compounds. A 438 W loss running 80% of the time for ten years is roughly 30,700 kWh, or USD 3,000-4,600 at industrial tariffs — several times the material cost difference between the smaller and larger bar in the earlier example.
That is why the loss calculation belongs in the purchase decision, not just in the design review. For high-duty applications — fast chargers, electrolysers, data centre links — the larger cross-section pays for itself in the first year of operation.
Buyers can ask suppliers for a loss-versus-cost table at the target duty cycle: current, drop, loss and the implied annual energy cost at three electricity prices. It turns the engineering calculation into a procurement decision.
The final reminder: losses scale with I², so a duty cycle that is 50% peak for 100% of the time is a different economic problem from one that peaks for minutes. State the duty cycle in the RFQ and the loss table will answer the rest.
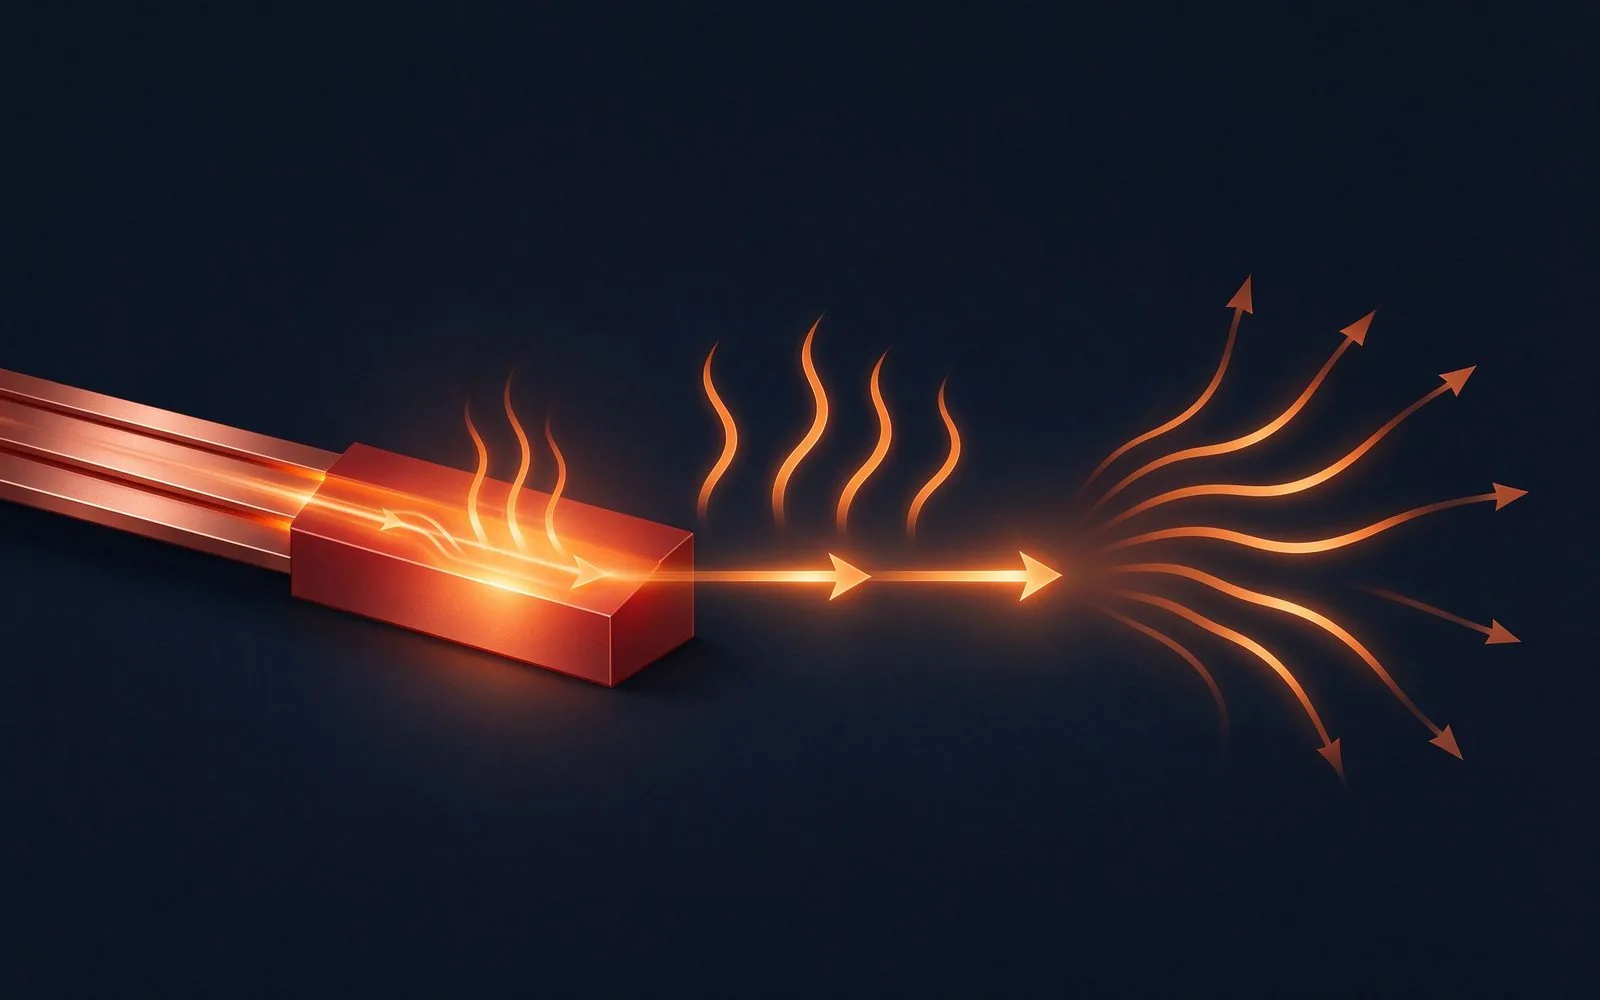
A busbar's rating is not a lookup — it is a calculation. Temperature rise is the real limi
Read article
At 20 kHz the skin depth in copper is 0.47 mm - most of a thick bar carries nothing but we
Read article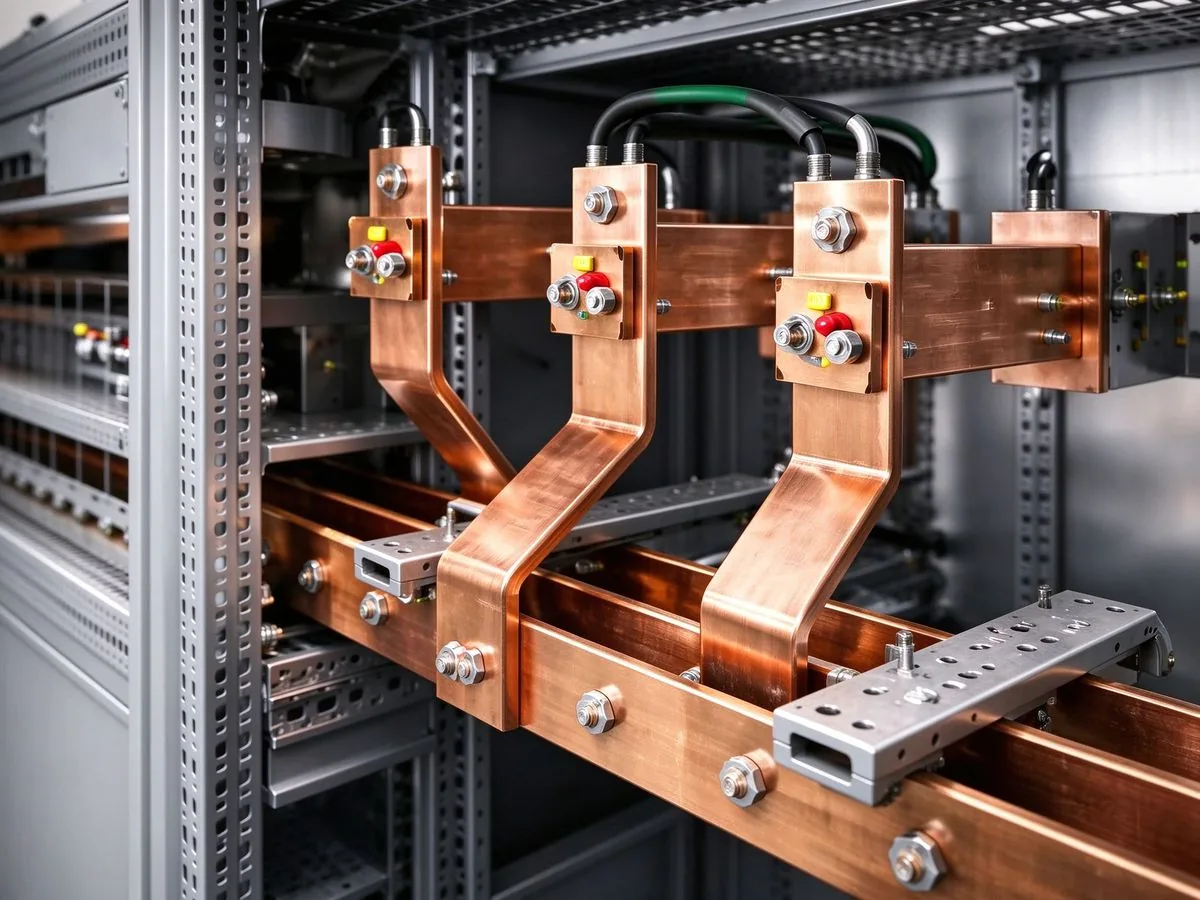
AI racks move from 140 kW to 1 MW by 2027, and the industry answers with 800 VDC distribut
Read article
Daniel Richter is the chief electrical engineer at SHANYUAN Laminated Busbars, with 15 years in laminated busbar design and current-carrying systems. He leads electrical dimensioning, DC-link layout and thermal simulation for power converters, EV platforms and HVDC stations, and holds an M.Sc. in El
Send the current profile, voltage class and terminal types — our engineers reply within one business day.