Every nanohenry of loop inductance in a converter's commutation path becomes volts of overvoltage spike when a SiC MOSFET switches at high di/dt. That is why the measurement of busbar parasitic inductance moved from a laboratory curiosity to a production acceptance test: the double-pulse test (DPT) is now the standard way to quantify the commutation power loop (CPL) stray inductance of a converter layout, and IEEE literature from 2025-2026 documents both the methodology and the achievable numbers. For a designer or a buyer of laminated busbars, understanding how that number is measured — and what makes a measurement trustworthy — is the difference between a datasheet and a design tool.
Every nanohenry of loop inductance in a converter's commutation path becomes volts of overvoltage spike when a SiC MOSFET switches at high di/dt. That is why the measurement of busbar parasitic inductance moved from a laboratory curiosity to a production acceptance test: the double-pulse test (DPT) is now the standard way to quantify the commutation power loop (CPL) stray inductance of a converter layout, and IEEE literature from 2025-2026 documents both the methodology and the achievable numbers. For a designer or a buyer of laminated busbars, understanding how that number is measured — and what makes a measurement trustworthy — is the difference between a datasheet and a design tool.
When a power module turns off, the current in the commutation loop must go somewhere. The energy stored in the loop inductance — 0.5 × L × I² — forces the drain-source voltage to overshoot above the DC-link voltage, and the overshoot amplitude is proportional to L × di/dt. In a SiC converter switching 500 A at 10 A/ns, every 10 nH of loop inductance adds roughly 50 V of overshoot on top of the DC-link voltage. Designers budget the overshoot against the device's maximum rating, so the loop inductance directly limits how fast the converter can switch or how much voltage margin it needs.
The loop in question is not the whole busbar; it is the commutation power loop — the current path through the DC-link capacitor, the busbar planes, the module terminals and the switching devices. A multi-layer laminated busbar exists precisely to shrink this loop: interleaved positive and negative planes cancel fields, and short, wide connections minimise loop area. Measuring the result is the topic of this guide.
The double-pulse test is the established time-domain method for extracting commutation-loop stray inductance. The setup uses the converter's own power stage: a load inductor is connected across the upper device, the upper device's gate-source is shorted so its body diode freewheels, and the lower device receives a long pulse followed by a short pulse. The first pulse builds the test current; the turn-off at the end of the first pulse and the turn-on of the second pulse create the high di/dt transients whose voltage response contains the loop inductance information.
From the measured waveforms, the stray inductance is extracted from the voltage spike at turn-off (the V_DS overshoot above the DC-link) or from the di/dt and voltage across the loop during the switching transient. A 2026 IEEE review of time-domain stray inductance measurement formalises the procedure — double-pulse test combined with systematic signal processing — and explicitly accounts for dc-link voltage oscillation and sensor uncertainties, which are the two biggest sources of measurement error in practice.
Measuring a 10 nH loop requires instrumentation fast enough to see it. The practical rules: a high-bandwidth oscilloscope (500 MHz minimum, 1 GHz preferred), low-inductance current probes or shunt measurement, differential voltage probes with matched delay, and a probe placement that does not itself add loop area. The probe ground lead is the classic trap — a 10 cm ground lead adds roughly 10 nH of its own, which is the same order as the inductance being measured. BNC-connected current shunts and kelvin-connected voltage sensing are the clean answers.
The second instrumentation rule is calibration of the measurement path. Before trusting an extracted inductance value, the test engineer should measure the fixture's own inductance and subtract it, and should verify the probes' bandwidth and delay matching. Our insulation testing practice follows the same philosophy — the test method is validated before the product is judged by it.
The raw DPT waveform is noisy in exactly the bands that matter: dc-link voltage oscillates during the switching transient, sensors have finite bandwidth and delay, and parasitic ringing between loop inductance and module capacitance rides on the signal. The 2026 IEEE methodology treats this systematically: filtering the voltage and current traces consistently (same delay, same bandwidth), extracting the inductance from a defined portion of the transient, and reporting the uncertainty bound rather than a single heroic number.
For a supplier, the discipline shows up as reproducibility: the same busbar measured on different days, or by different test houses, should give the same inductance within the stated tolerance. Buyers should ask what the tolerance is and how it was established — a certificate that quotes '14.4 nH' with no uncertainty statement is a number without a warranty.
The reference values are useful calibration points. A 2025 IEEE design for a 10 kV SiC MOSFET module reports a power-module interconnection busbar achieving 14.41 nH loop inductance, validated with double-pulse testing. A 2026 IEEE report on an FPC-integrated SiC module demonstrates ultralow parasitic inductance with balanced dynamic current sharing under high dv/dt and di/dt conditions. Both confirm the same message: with mirrored laminations, tight terminal spacing and decoupling capacitance integrated into the DC board, single-digit-to-mid-teen nanohenry values are real, measured numbers — not marketing claims.
These references also show the measurement pattern: DPT as the validation method, loop inductance as the headline metric, and switching waveforms as the supporting evidence. For a power electronics busbar buyer, matching those evidence standards in the supplier's test file is the right bar.
Not every busbar is a simple two-plane sandwich. Multi-port laminated busbars — the DC links that distribute to several modules or several racks — have multiple current paths, and the single-loop DPT extraction gives one number for the path that was switched. The vector synthesis method addresses this: it measures the impedance contributions of the individual ports and synthesises the resulting loop inductance for the paths that matter. Northumbria University's 2026 work on low-inductance planar multi-port busbars details the technique, which is useful when the busbar's data sheet needs a per-port inductance matrix rather than one headline number.
For most industrial converters, the per-path number is what the designer needs: the module-to-module paths that carry the fastest switching. A low-inductance design review at the layout stage decides which ports exist; the measurement confirms what the layout promised.
During a hard switching transient, the DC-link capacitor's own inductance and the busbar's series path interact: the capacitor does not hold the bus perfectly stiff at the moment of switching, so the voltage across the loop oscillates at the module's resonant frequency. If the extraction treats the DC-link as an ideal voltage source, the computed inductance is wrong by the amount of the oscillation. The 2026 IEEE methodology addresses this explicitly — the dc-link voltage during the transient is measured and its dynamics are included in the extraction.
The practical mitigation is also a design lesson: integrate decoupling capacitors into the DC capacitor board as close to the module terminals as possible, which is exactly the approach used in the press-pack SiC module work and the FPC-integrated module work cited above. The shorter the path the local capacitor can serve, the less the distant DC-link oscillation contaminates the switching loop. Our DC-link busbar designs are built around this principle.
Loop inductance measurement belongs at three points in the product lifecycle. At design validation, DPT on the prototype verifies the simulation — a FEM impedance simulation that predicted 12 nH should meet a DPT that measures 12 ± 1 nH. At first article, the measurement becomes part of the dimensional and electrical acceptance. And at series production, a periodic verification keeps process drift — layer spacing, terminal position, lamination pressure — from silently raising the inductance.
The series-production question is economic: a full DPT rig on every busbar is overkill for most programmes, but a correlated surrogate — a high-frequency impedance measurement at the terminals that tracks the DPT result — can screen every unit at production speed. The correlation has to be proven once and re-validated periodically; after that, the acceptance file can carry the surrogate result plus the DPT reference.
A defensible busbar inductance specification has five elements: the loop definition (which path, between which terminals), the test method (DPT with stated conditions, or the correlated surrogate), the target value and tolerance (e.g., 15 nH ± 15%), the test conditions (voltage, current, temperature, probe setup), and the uncertainty statement. Without the loop definition, two parties can measure the same busbar and honestly report different numbers — the classic dispute that costs a programme a month.
Buyers should also specify the failure response: what happens if the measured value exceeds the target. The engineering answer is layout review, not scrap — terminal spacing, layer stack or decoupling placement changes the number more than material changes do. Our custom busbar loop handles that review with the simulation and measurement together, so the fix is designed, not guessed.
Loop inductance responds to a short list of layout choices. Terminal spacing is first: every extra millimetre between positive and negative terminals adds roughly 1 nH per cm of path. Layer stack is second: interleaved planes with thin dielectrics maximise field cancellation, and a multi-layer construction cuts inductance faster than a two-layer one for the same footprint. Cut-out geometry is third — windows, slots and notches redirect current and change the effective loop. Fourth is decoupling placement: capacitors on the module side of the busbar serve the switching loop; capacitors far away serve the DC link, and the two are not interchangeable.
The high-frequency design guide covers how current crowds into the plane edges at switching frequencies, which matters when the busbar is wide and the loop is fast. Measuring at the operating frequency band is part of doing the measurement honestly.
The top five mistakes in loop inductance measurement: using a long probe ground lead (adds inductance of its own); extracting from a filtered waveform that removed the transient of interest; assuming a stiff DC link instead of measuring it; mixing sensor delays between the voltage and current channels; and quoting a single measurement without repeats or uncertainty. Each is fixable with procedure: kelvin connections, bandwidth-matched filtering, measured DC-link dynamics, delay-matched probes, and a defined repeatability protocol.
Test houses that follow the 2026 IEEE methodology publish their procedure; suppliers that follow it reproduce their numbers. When a busbar certificate arrives, the first question is not the number — it is the method. The second is the loop definition. The third is the uncertainty. If all three are documented, the number is worth discussing.
The measured loop inductance plugs directly into the converter's loss and margin budget. With L known, the designer computes the overshoot at the target di/dt, checks it against the device rating with margin, and decides whether the switching speed can rise. The same L feeds the ringing frequency with the module output capacitance, which determines the EMI spectrum. A 5 nH improvement in the busbar can therefore buy either faster switching (lower loss) or lower EMI (cheaper filters) — the designer chooses which to spend it on.
That is why the number is worth measuring well: it is the interface between the mechanical part (the busbar) and the electrical result (the converter's efficiency and reliability). The inverter applications page shows where this trade-off concentrates in real products.
Loop inductance is not a single fixed property of the copper; it is a property of the loop under test conditions. Frequency matters because skin effect changes current distribution — a wide busbar's effective inductance at 10 kHz differs from its value at 1 MHz, and the DPT transient excites the switching-frequency band, so the measured number reflects that band. Temperature matters at the margins. And the load current matters because it sets the di/dt at which the transient is extracted; measuring at 100 A gives a noisier, less representative number than measuring at the converter's rated current.
The specification should therefore state the test current, the DC-link voltage, the temperature, and the probe bandwidth — and the certificate should repeat them. A number measured at 23°C, 50 A, with a 200 MHz scope is a different number from the same geometry measured at 85°C, rated current, 1 GHz. Neither is 'wrong'; they are just different conditions, which is precisely why the condition statement is part of the acceptance criteria.
The measurement verifies a prediction; the prediction comes from simulation. A finite-element impedance simulation of the busbar layout gives the loop inductance map before any copper is cut, and it is the tool that answers the layout questions — where to move terminals, how many layers, where the decoupling lands. The simulation and the DPT measurement then close the loop: if they disagree beyond the uncertainty band, either the model missed something (edge geometry, terminal contact, capacitor placement) or the measurement is contaminated, and resolving the disagreement is where the real engineering value sits.
For buyers, the practical consequence is that a supplier with both simulation and measurement capability delivers a shorter design cycle: the layout is right on the first prototype, and the certificate matches the simulation that was reviewed at the drawing stage. Suppliers who measure without simulating force the iteration onto physical prototypes, which is slower and more expensive for everyone.
At switching frequencies, current crowds to the surfaces and edges of the busbar conductors — the skin effect — and the effective resistance and inductance change accordingly. In a wide laminated plane, the current distribution across the width determines how much of the plane actually participates in the commutation loop, and edge crowding can make the measured inductance differ from the DC-geometry estimate. The effect is second-order for most industrial converters but first-order for high-frequency SiC designs switching above 100 kHz.
The measurement and the design should both acknowledge this: the DPT result is the frequency-band value, and the simulation should be run at the same band. Our harmonic rating and current sharing guides treat the same physics from the rating side, and together they cover the full picture for a high-frequency DC link.
The loop inductance a converter actually switches against is the sum of the busbar path plus the capacitor's own parasitic inductance. That is why decoupling capacitor placement is inseparable from busbar design: a capacitor integrated onto the DC board close to the module terminals serves the switching loop directly, while a capacitor at the far end of the busbar only serves the DC link. The press-pack SiC module work cited earlier integrates decoupling onto the DC capacitor board specifically to shrink the loop the module sees.
The measurement consequence: DPT on a busbar alone gives one number, and DPT on the full stack — busbar plus capacitors plus module — gives the number the converter actually lives with. Acceptance criteria should be clear about which loop is being quoted. Our low-inductance design resource walks through the layout sequence that puts the capacitors where they earn their value.
A credible loop inductance certificate includes the extracted value, the loop definition, the test conditions, the uncertainty statement, and the supporting waveforms — the turn-off overshoot trace and the current trace at the extraction point. The waveforms are the part most certificates omit and the part that lets a second engineer verify the extraction: the overshoot knee and the di/dt slope are visible in the trace, and the inductance can be re-derived by hand from the raw data.
Buyers should ask for the waveform file, not just the PDF, and should archive it with the order records. When a converter later shows excessive switching overshoot in the field, the audit trail decides whether the busbar met its spec or whether the design moved. Our quality page describes the document control behind the test files we ship with every power electronics busbar.
Can I trust a datasheet inductance value without a DPT report? Treat it as a design target, not a measured fact — the method and loop definition should travel with the number. How low can a laminated busbar go? Published SiC module designs reach the 10-15 nH range for module-interconnection sections; lower needs integrated packaging like FPC modules. Does the measurement change with temperature? Slightly, through skin effect and material properties; the test condition should be stated. How do I get a measured inductance on my design? Send the layout to our engineering team — the simulation runs first, and the prototype DPT verifies it.
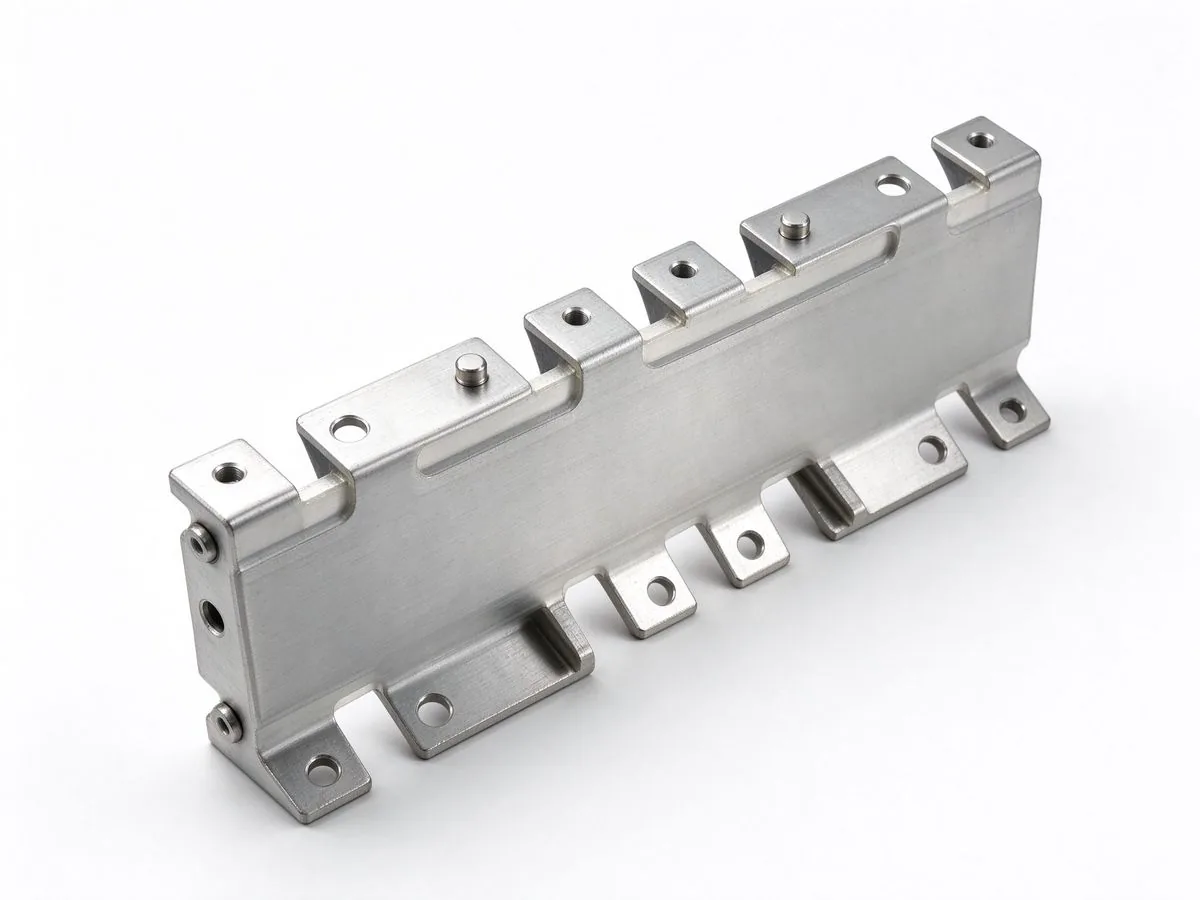
Higher switching speeds from SiC MOSFETs and modern IGBTs are pushing the DC-link busbar t
Read article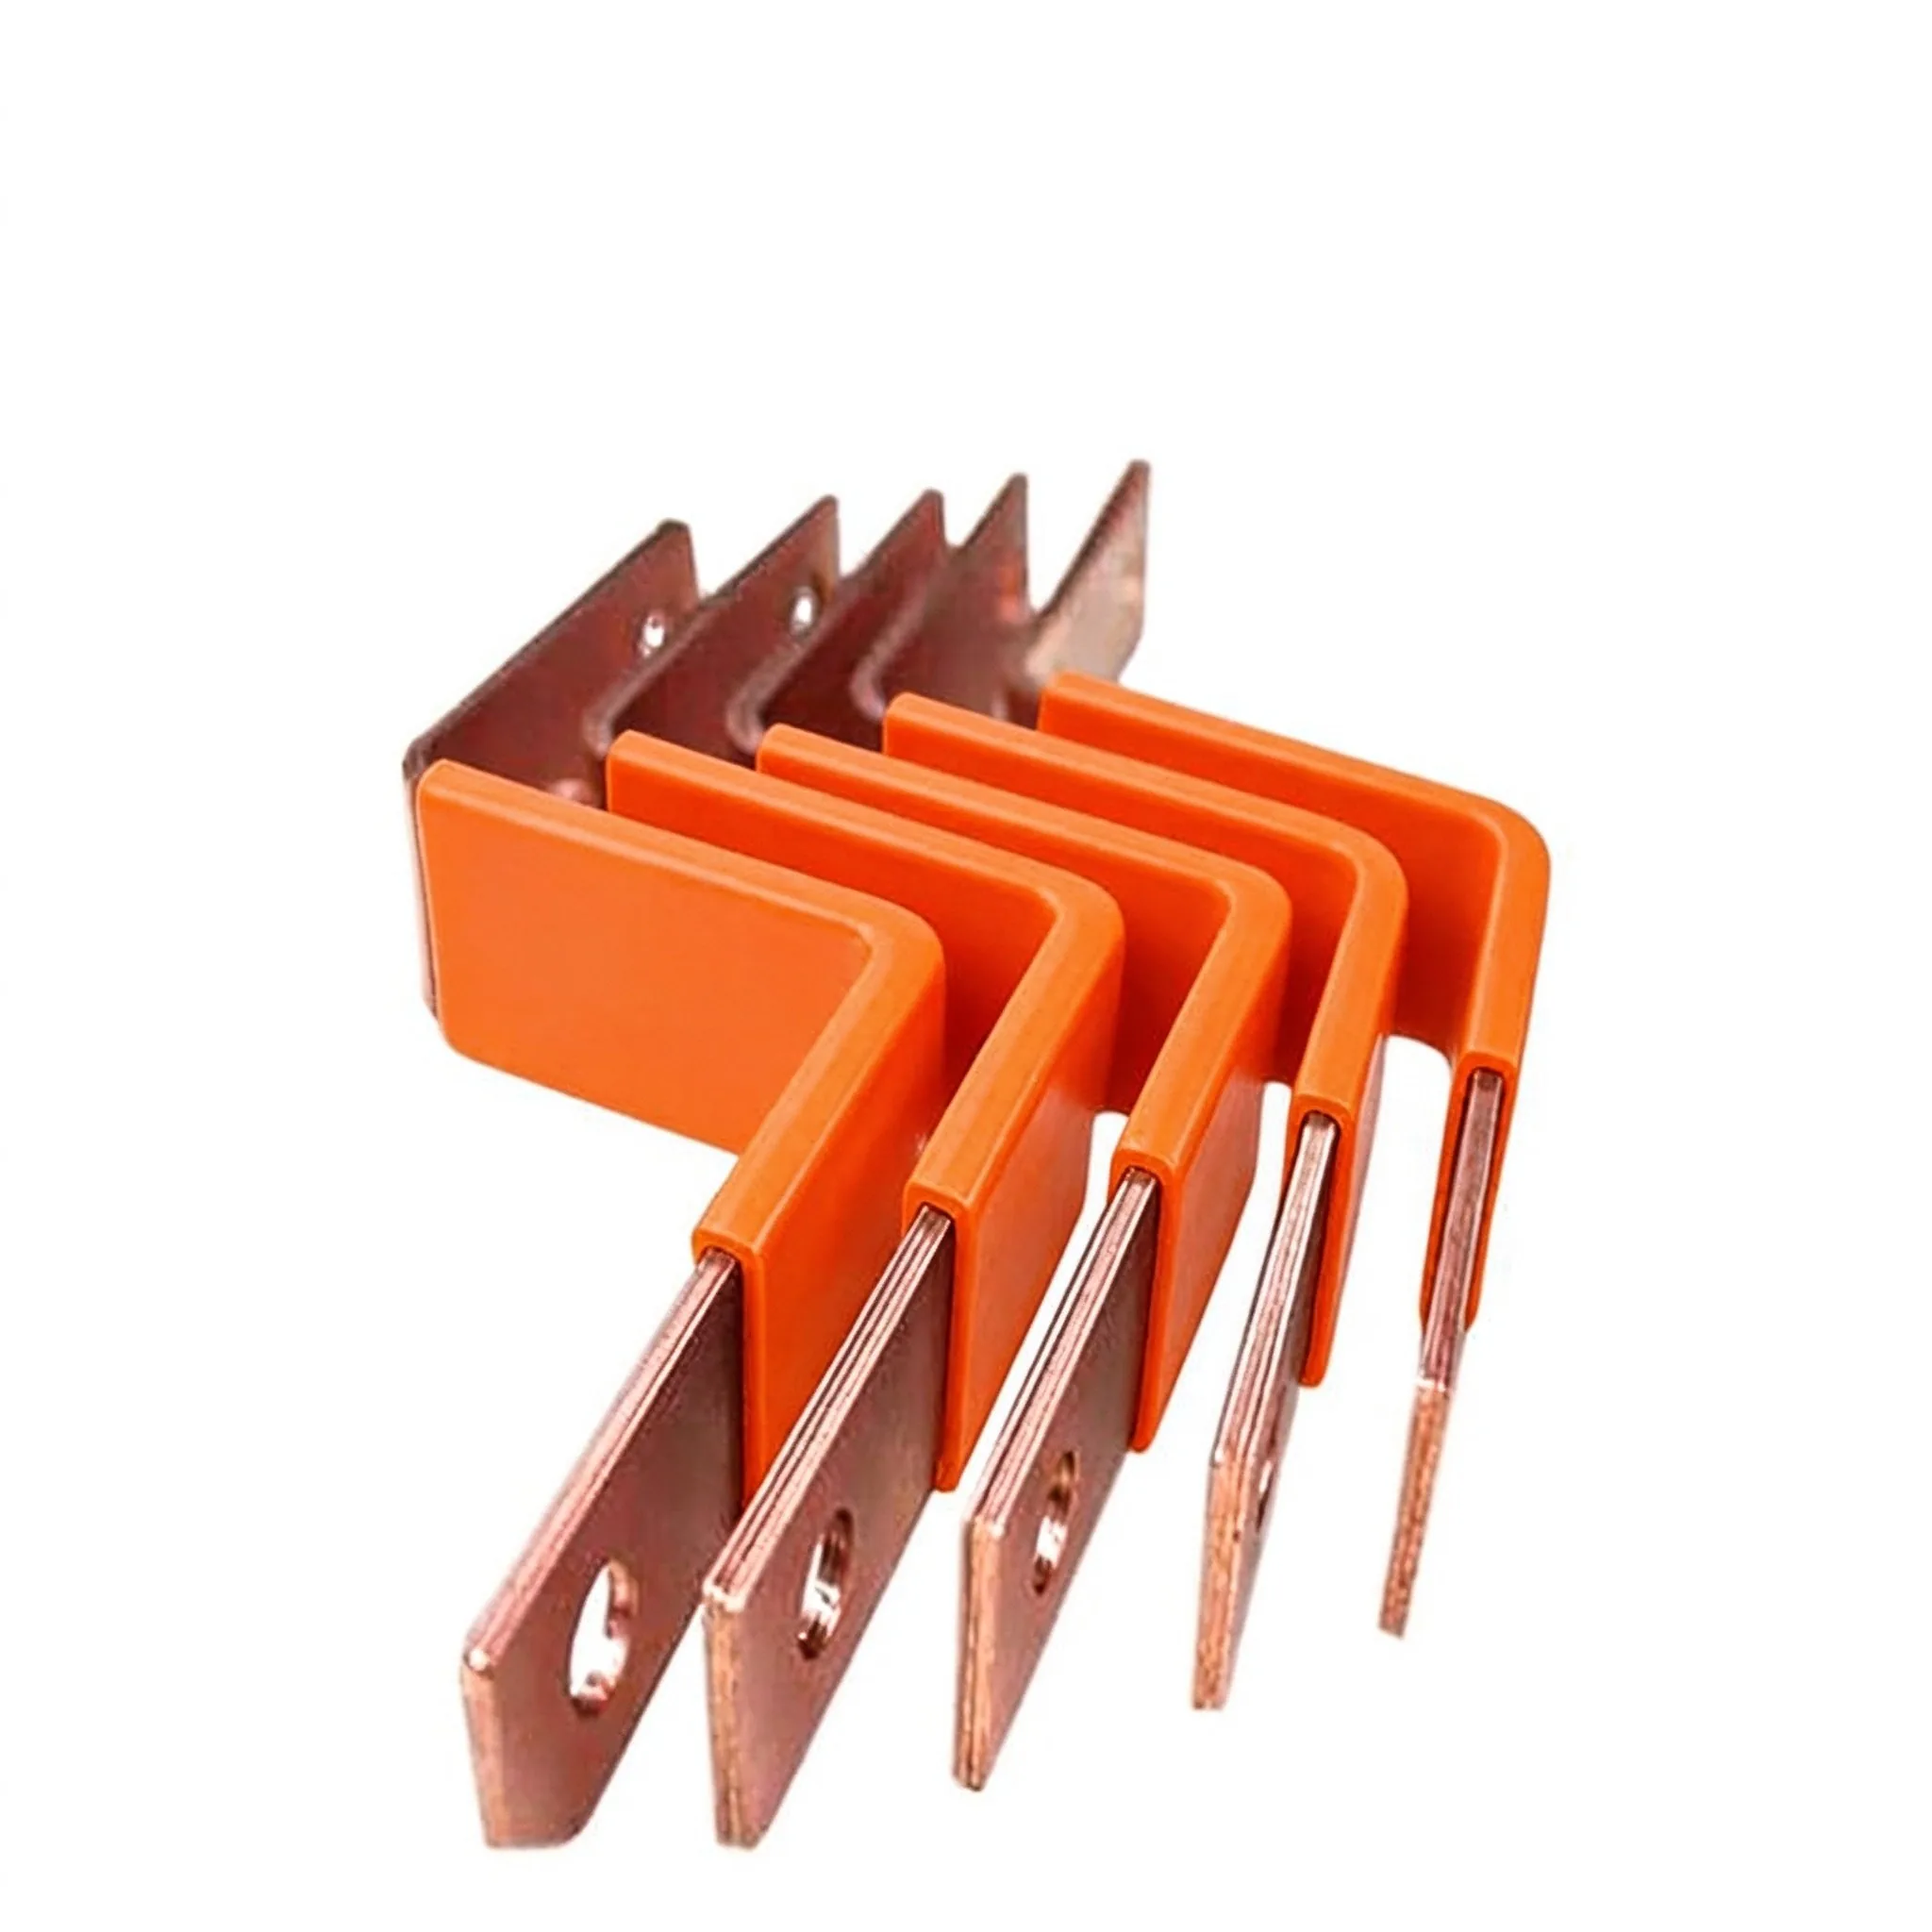
L_loop = Lp,P + Lp,N - 2Mp,PN: the partial-inductance equation behind every low-inductance
Read article
At 20 kHz the skin depth in copper is 0.47 mm - most of a thick bar carries nothing but we
Read article
Daniel Richter is the chief electrical engineer at SHANYUAN Laminated Busbars, with 15 years in laminated busbar design and current-carrying systems. He leads electrical dimensioning, DC-link layout and thermal simulation for power converters, EV platforms and HVDC stations, and holds an M.Sc. in El
Send the current profile, voltage class and terminal types — our engineers reply within one business day.