A busbar is the cheapest component in a power converter and the most consequential to its switching behaviour. Parasitic inductance in the commutation loop sets voltage overshoot, damping and switching loss; parasitic capacitance sets the common-mode path; AC resistance sets the high-frequency loss. All three are geometry properties, which means all three are computable before a single gram of copper is cut. This guide covers the two-step discipline we use in production programs: the partial-inductance hand check, then 3D FEM extraction with validation against double-pulse testing.
A busbar is the cheapest component in a power converter and the most consequential to its switching behaviour. Parasitic inductance in the commutation loop sets voltage overshoot, damping and switching loss; parasitic capacitance sets the common-mode path; AC resistance sets the high-frequency loss. All three are geometry properties, which means all three are computable before a single gram of copper is cut. This guide covers the two-step discipline we use in production programs: the partial-inductance hand check, then 3D FEM extraction with validation against double-pulse testing.
For a two-plane DC-link pair, the loop inductance is written as L_loop = Lp,P + Lp,N - 2Mp,PN, where Lp,P and Lp,N are the self partial inductances of the positive and negative layers and Mp,PN is the mutual partial inductance between them (NovaSolver, 2026). The equation says everything that matters: loop inductance falls when the two planes are close (raising the mutual term) and when they are wide (lowering self inductance). It also explains why layer stacking order and inter-plane spacing are design variables, not details.
The partial-element equivalent circuit (PEEC) method generalises this to any conductor arrangement: divide the conductor into cells, compute the partial self and mutual terms between every cell pair, and assemble the matrix. It is the analytical backbone under every 'busbar inductance calculator' worth using.
FEM gives precision; the partial-inductance estimate gives understanding. Before opening a solver, a hand check with the loop equation and measured plane dimensions separates the designs that are fundamentally sound from those that are not. If the rough loop inductance of a candidate geometry is already above the target, no mesh refinement will fix it - the layout must change.
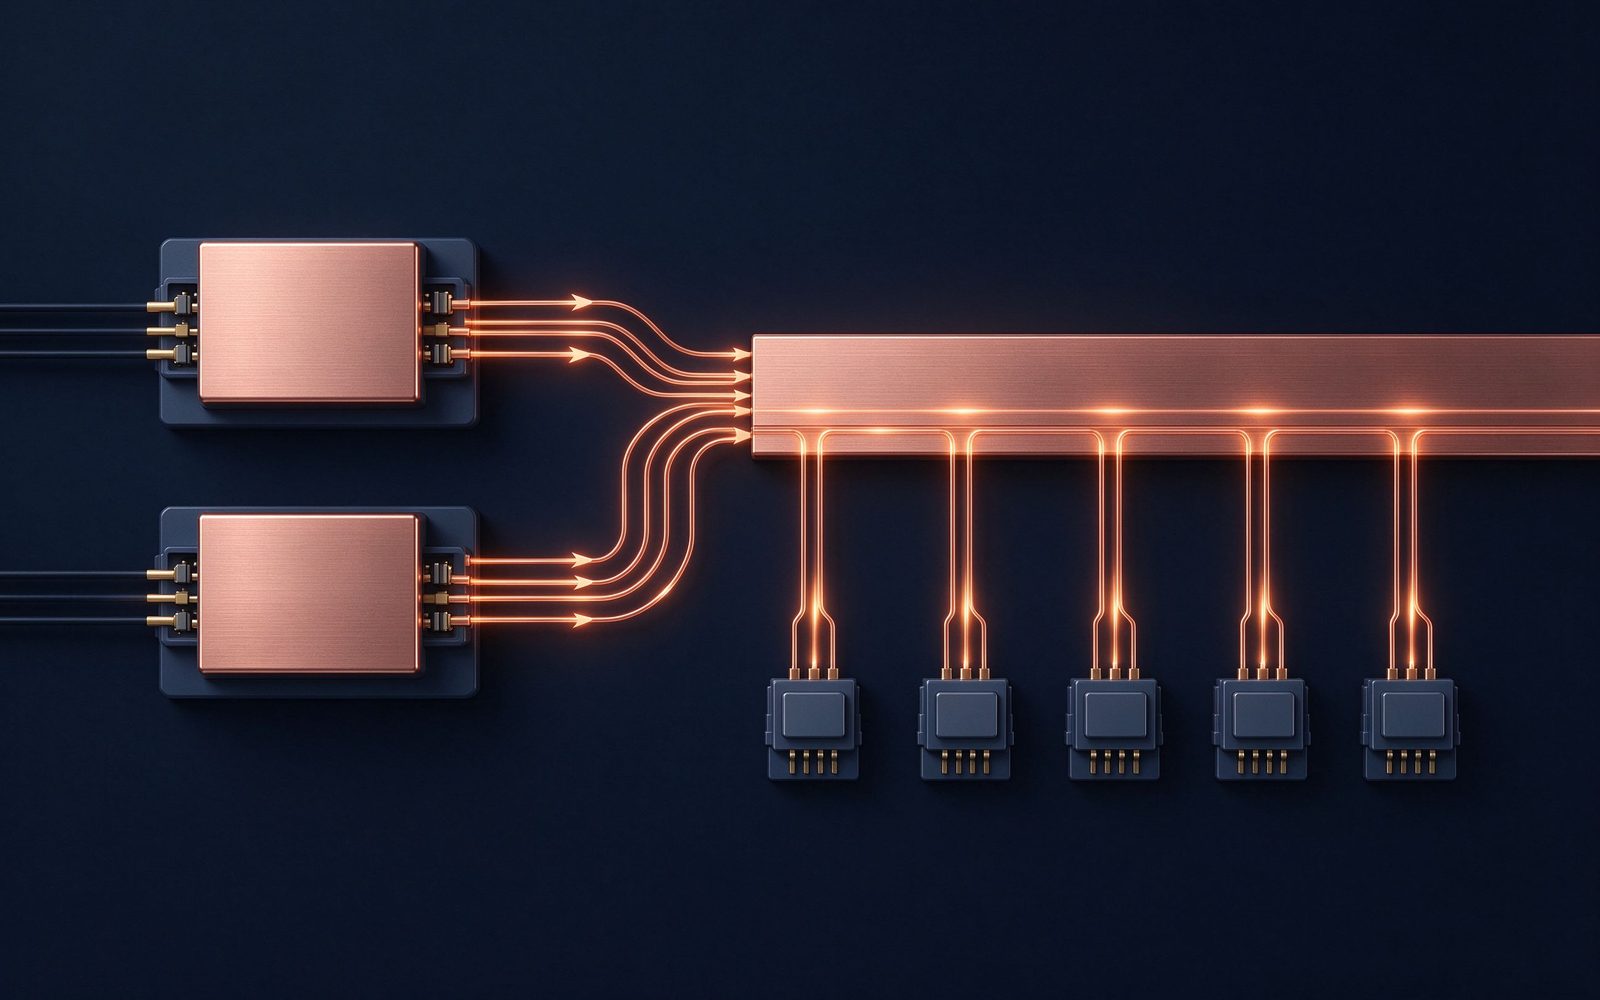
In production practice, the hand check also catches the common mistakes - a terminal moved 10 mm, a cut-out that splits the return plane - that a black-box solver output hides inside a beautiful colour plot.
For busbar parasitics, three methods cover the practical space. 2D/3D magnetostatic FEM (finite element) solves the inductance matrix directly from geometry and material properties; it is the workhorse for layer stacks and terminal layouts. Quasi-static field solvers such as ANSYS Q3D Extractor compute the full resistance, inductance and capacitance (RLC) matrix, handling skin and proximity effects in the frequency domain (IEEE literature uses Q3D for exactly this, validated against measurement - MDPI, 2017). For multi-level converters, the RLC matrix of segments S1..Sn is assembled segment by segment (Yi et al., IEEE, 2008).
Frequency-domain solvers matter because a single inductance number at DC misleads at switching frequency: the effective loop inductance and the AC resistance both shift with frequency, and the shift is exactly where SiC converters live.
A practical note on method choice: the frequency-domain extraction is the right tool for the design, but the DC magnetostatic solve still has a role as the sanity check. The DC inductance of the same geometry, extracted in a few minutes, anchors the frequency-dependent result at the low-frequency limit and catches gross modelling errors before the expensive frequency sweep runs. The two results together - DC anchor and frequency sweep - are what make a convergence study meaningful rather than ritual.
The same discipline applies to the material data. Resistivity at the operating temperature, not at 20 °C, is the input that keeps the AC-resistance result honest, and the temperature assumption must be stated on the report page so a reviewer can re-run the extraction at the actual operating point. Reproducibility of the temperature input is as much a documentation obligation as reproducibility of the mesh.
The most common FEM failure is an honest-looking wrong answer from an under-resolved mesh. The governing rule: at least three or more element layers within the skin depth at the analysis frequency. At 20 kHz, delta = 0.47 mm in copper, so the mesh needs element sizes of 0.15 mm or less within 0.47 mm of every conductor surface; the conductor centre, carrying almost no current, can be coarse (NovaSolver, 2026). At 100 kHz the surface layer is 0.21 mm and the mesh must follow.
A mesh-convergence study - solve at two or three refinements and confirm the inductance and resistance change by less than a few percent - is the acceptance test for any extraction. Without it, the number is a guess with a plot attached.
From the converged field solution, the solver extracts the resistance, inductance and capacitance matrix of the busbar. The diagonal entries are the self terms; the off-diagonal entries are the mutual terms that couple every conductor segment to every other. In a three-layer NPC busbar, the RLC matrix between the positive, neutral and negative planes is what makes the commutation loops of the upper and lower switches calculable (IEEE, 2014; Yi et al., 2008).
The capacitance matrix deserves the same attention as the inductance. Inter-plane capacitance forms the common-mode path that drives conducted EMI, and the busbar's resonance - the frequency at which inductance and capacitance meet - shows up in the impedance sweep of the real converter.
Once the RLC matrix is in hand, the next step is a circuit co-simulation: the extracted matrix feeds the converter model, and the switching waveform comes out with overshoot, oscillation frequency and damping. Optimisation studies in the IEEE literature evaluate surge voltage, damped oscillation and switching loss together as design objectives, and an optimised geometry achieved simultaneous reductions of 13.2%, 49.7% and 29.7% in those three quantities in a 400 V / 30 A buck converter (Mitsui et al., IEEE, 2021).
That is the level of control the design target deserves: the busbar is optimised for the waveform it creates, not for a single inductance number.
Simulation earns trust only against measurement, and the standard measurement for switching behaviour is the double-pulse test (DPT) on the actual devices and busbar. Recent IEEE work validates the analytical partial-inductance method against 3D FEM (ANSYS Q3D) and against double-pulse tests on a 3.3 kV SiC MOSFET converter (IEEE Xplore, 2026) - the same three-way chain we use in traction and inverter programs.
The DPT reveals what the solver may miss: the mounting inductance of the module, the capacitor ESL, the loop through the heatsink. When the measured overshoot disagrees with the simulation, the first suspects are unmodelled mounting loops, and the fix is usually a shorter, wider connection rather than a solver tweak. Traction programs run exactly this validation chain - see our SiC traction converter DC-link article for the rail-specific constraints.
EV traction and DC-link buses frequently parallel multiple switch branches. Each branch carries a share of the current, and asymmetric layout gives each branch a different partial inductance - which shows up as unequal current distribution and unequal switching stress (MDPI, 2017, partial stray inductance modelling and measurement of asymmetrical parallel branches on EV busbars).
Q3D-style extraction handles this correctly when each branch is excited with its own source/sink pair, and the measured values validate the model. The design rule is simple: mirror the branches symmetrically, or accept and document the imbalance.
Inductance and resistance come from one field solution; temperature comes from another, and the two couple. AC resistance rises with temperature (copper's resistivity increases), which raises loss, which raises temperature. A credible busbar study therefore closes the loop: electromagnetic extraction at the operating temperature, thermal solve on the loss distribution, then re-extraction if the temperature shift is material. For kiloamp stacks and SiC frequencies, the coupling is not negligible. The thermal management guide covers the thermal side of the same design.
A pragmatic workflow: (1) define the commutation loop and set the inductance target from the device datasheet's safe di/dt; (2) hand-check the plane pair with the partial-inductance equation; (3) build the 3D model from the actual drawing including terminals, cut-outs and capacitor positions; (4) extract RLC with a skin-resolving mesh and run the convergence study; (5) feed the matrix into the circuit model and iterate the geometry against overshoot and loss; (6) validate with double-pulse on the prototype. Every step is reproducible, and every number survives the review meeting.
The workflow statement deserves a production note. In a manufacturing context, the electromagnetic study and the drawing are one deliverable: the extracted loop inductance and AC resistance become target values on the drawing, the first article is measured against them, and the production inspection records the geometry variables the model is sensitive to - layer thickness, inter-plane spacing, terminal position, plating. When the measured part drifts from the extraction, the review starts with the manufacturing variables, not with a solver argument. That linkage is what makes simulation a manufacturing tool rather than a CAE exercise.
The same linkage applies to the thermal side. The loss map from the electromagnetic extraction feeds the thermal model, the temperature field feeds the material resistivity, and the resistivity feeds back into the loss - the closed loop that a credible kiloamp design closes before cutting copper. Our thermal management guide covers the thermal half of that loop; this guide covers the electromagnetic half, and the two belong on the same design file.
When you buy a custom laminated busbar, the electromagnetic report should come with the part: the extracted inductance and AC-resistance curves, the convergence evidence, and the double-pulse or impedance measurement from the prototype. If the supplier cannot produce the numbers, the 'low inductance' claim is marketing. SHANYUAN provides the extraction and the test data with production programs - see our power-electronics laminated busbar and inverter DC-link busbar pages for the families involved.
The vendor question completes the picture. When the supplier hands over the electromagnetic report, the buyer should check four things: the loop inductance and AC-resistance targets are stated numerically and tied to the device datasheet; the extraction settings and convergence evidence are on the page; the measurement that validated the model is named and dated; and the manufacturing variables the model is sensitive to are listed on the drawing. A report that fails any of the four is a slide deck, not a design file - and the difference shows up on the bench.
Final checklist: write the loop equation by hand first; set the target from the device's di/dt; simulate with skin-resolving mesh and a convergence study; extract the full RLC, not just inductance; co-simulate the switching waveform; validate on double-pulse; and archive the report with the part. Our engineering desk runs this chain on custom programs - send the converter profile and the electromagnetic study returns with the quotation. Related background: low-inductance busbar design and the inverter application page.
A full 3D field solution is not a circuit. To use the extracted parasitics in a converter simulation, the field result must be reduced to an equivalent circuit: a network of partial inductances, resistances and capacitances that reproduces the terminal behaviour over the band of interest. Model order reduction (MOR) automates this, fitting a low-order equivalent network to the frequency-domain extraction.
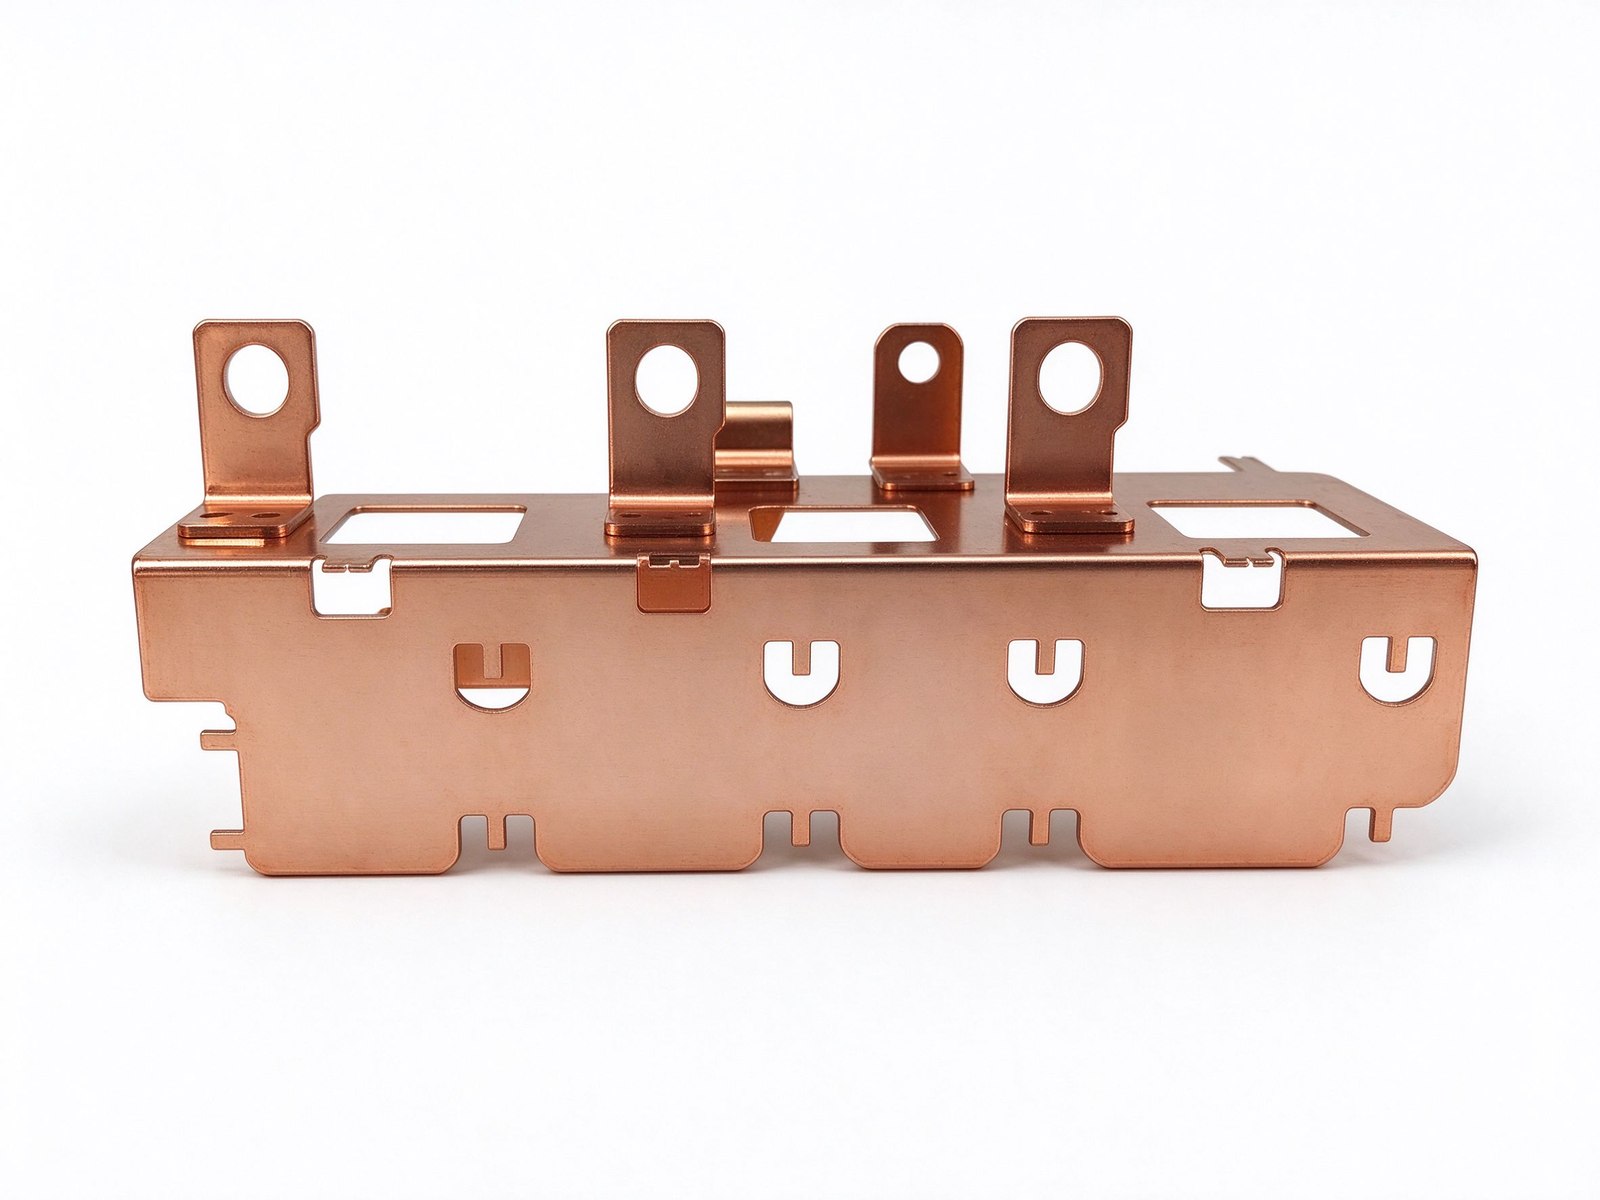
The practical benefit is speed and clarity: the reduced network runs in the circuit simulator in milliseconds, and the design team can sweep terminal placement, film thickness and layer order against the switching waveform without re-running the full field solve each time. The equivalent circuit is also the natural hand-off document between the CAE team and the power electronics team.
The busbar is not the whole commutation loop. The capacitor bank contributes its own ESL and ESR, the power module contributes package and terminal inductance, and the loop through the heatsink or cold plate adds a low-frequency path. The honest loop model includes all of them: the busbar extraction feeds the loop model, which must be validated against the double-pulse measurement of the real assembly.
In practice, the capacitor ESL often dominates the total loop at the device terminals - which is why placing capacitors close to the module and keeping the busbar wide and short is a system layout decision, not a busbar detail. The measurement protocol (DPT with the actual capacitor bank and modules) is the referee between the model and the bench.
An electromagnetic study is only as useful as its documentation. A production-ready busbar report should contain: the loop inductance target and its derivation from the device datasheet; the partial-inductance hand check; the extraction settings (frequency, mesh size, material properties); the convergence study; the RLC matrix or reduced equivalent circuit; the waveform co-simulation versus the design objectives; and the double-pulse or impedance-sweep measurement on the prototype. Every number should be reproducible from the inputs.
This is the file an OEM's review board signs, and it is the file that survives to the next program. Suppliers who ship the part without the report are shipping a guess with a drawing.
The documentation standard also serves the next program. Every traction or inverter program that reuses the same busbar geometry can carry the previous report forward as a baseline, with only the delta - new devices, new current profile, new enclosure - re-extracted. That is how an electromagnetic discipline compounds: the report library becomes the company's design knowledge, and the review board's trust in the numbers grows with every validated program. The alternative - a fresh extraction with no baseline on every program - wastes both engineering time and the evidence that would have caught a geometry regression early.
The recurring mistakes are few and identifiable. Mesh too coarse to resolve skin depth - caught by the convergence study. Excitation set as total current instead of per-branch sources - caught by comparing per-branch results with the design intent. Material resistivity at 20 °C instead of operating temperature - caught by the thermal co-simulation. Missing the mounting loop - caught by the double-pulse test. And the classic: optimising the busbar to a single inductance number while ignoring the capacitance it adds - caught by checking the resonance against the switching band.
Every one of these shows up in the validation step, which is why the measurement is not the end of the workflow - it is the gate. The frequency side of the same discipline - skin and proximity effects on AC resistance - is covered in our skin effect guide.
The solver brand matters less than the reproducibility of the setup. A credible extraction documents the software version, the material data used (resistivity at which temperature), the mesh settings, the excitation and boundary conditions, and the convergence evidence - enough for a reviewer to reproduce the result. Commercial field solvers and open-source electromagnetic tools both produce honest answers when the mesh and the physics are set up correctly; both produce plausible-looking wrong answers when they are not.
The practical advice for a program team is to standardise on one documented workflow rather than chase solver features. The workflow - hand check, extraction, co-simulation, validation - is the deliverable that repeats across programs, and it is what our engineering desk runs on every custom busbar before quoting.
The electromagnetic study earns its keep only if the manufactured part matches it. The bridge is manufacturing control: the laminate stack order, the inter-plane film thickness, the terminal position and the plating must hold the geometry the model assumed, or the measured inductance drifts from the extracted value. That is why the drawing carries the tolerance, why the first article is measured (dimensions plus impedance or DPT), and why the production inspection records the variables that the model is sensitive to.
In short: the simulation defines the target, the drawing holds the target, and the inspection proves the part hit it. Programs that skip the middle step discover the drift on the bench - and pay for it in the schedule.
Send the current profile, voltage class and terminal types — our engineers reply within one business day.