Busbar quotes arrive in different shapes. One supplier quotes per piece at 1,000 units, another at 10,000 with a tooling charge, a third adds a freight surcharge and a four-week premium for expediting. Comparing the headline number is how procurement teams end up with a cheaper part that costs more to own. The fix is arithmetic, not negotiation: convert every offer to a landed cost per good unit at the volume you will actually consume.
Busbar quotes arrive in different shapes. One supplier quotes per piece at 1,000 units, another at 10,000 with a tooling charge, a third adds a freight surcharge and a four-week premium for expediting. Comparing the headline number is how procurement teams end up with a cheaper part that costs more to own. The fix is arithmetic, not negotiation: convert every offer to a landed cost per good unit at the volume you will actually consume.
First published 6 November 2026 · Last updated 12 November 2026
A laminated busbar has three cost layers. Material is copper, plating and dielectric film, priced against a metal index that moves. Conversion is press, bend, punch, plate, test and pack, priced against labour hours and machine time. Amortisation is tooling, fixtures and first-article qualification, priced once and recovered across the order.
Suppliers compete hardest on the first layer because it is visible and easy to benchmark. They compete least on the third because it is buried in the quote. A buyer who compares only the per-piece figure is effectively letting the supplier choose the amortisation assumptions. The framework below makes those assumptions explicit and puts them on the same basis.
Every busbar offer can be decomposed into five blocks: piece price (material plus conversion), tooling and NRE, inventory carrying cost driven by MOQ and lead time, freight, duty and insurance, and quality risk (incoming inspection, scrap, line stoppage, warranty). A sixth block, switching cost, applies only when changing suppliers and is treated separately.
The blocks behave differently. Piece price falls with volume. Tooling is fixed and falls per unit as volume rises. Inventory cost rises with MOQ and lead time. Freight depends on density and route, not on volume beyond container thresholds. Quality risk falls with supplier maturity but rises with any change, including a cost-down change.
The blocks also behave differently across the program life. Piece price and freight are roughly flat per year. Tooling is front-loaded. Inventory cost peaks in the ramp year and falls once demand stabilises. Quality risk is back-loaded, because a process weakness shows up after the warranty period starts. That timing matters: a supplier who is cheap in year one and expensive in year three can look better on a one-year budget than on a program P&L.
Start by stripping the copper. Ask each supplier for the copper mass per part and the index basis they used (LME copper, month of quote, plus a conversion premium). Two quotes that differ by 6% in price often differ because one used a three-month-old index. Re-base both to the same index date before comparing.
Then normalise the conversion element: plating thickness and underplate, test regime, packaging, and whether the price includes the first article. A quote without a first article is not comparable to one with it, because the qualification cost has simply moved into the ramp. The material comparison note explains why copper mass is the honest denominator when comparing designs.
One caution on the material line: a thinner bar can look cheaper per kilogram and still cost more per ampere once the ampacity derating for the real cabinet ambient is applied.
Plating and test are the two specification fields that move the price most, and both are easy to leave vague. A tin finish over nickel with a specified thickness adds two process steps compared with a bare tin dip; a routine partial discharge test adds a station and a trained operator. If the RFQ does not state them, each supplier will price a different product, and the comparison becomes meaningless before the arithmetic even starts.
Tooling for a laminated busbar is modest compared with injection moulding: press dies, bend fixtures, punch plates, test fixtures, and occasionally a dedicated plating rack. Typical range is a few hundred to a few thousand US dollars per part number, plus the engineering time for first article and any qualification testing.
The honest way to amortise is over the realistic program life, not the first purchase order. A tool amortised over 5,000 units adds a small amount per piece; the same tool amortised over 500 units adds ten times as much. When suppliers quote different MOQ tiers, they are often quoting different amortisation windows without saying so. Put the window in the comparison sheet as an explicit field.
Tooling ownership is a separate question from tooling cost. Some suppliers amortise the tool into the piece price and retain ownership; others charge it upfront and transfer the tool to the buyer. The first is cheaper in cash flow but locks the buyer in, because moving the part means paying for the tool twice. For a platform with a five-year life, buying the tool outright is usually the better position, and it is worth a few percent on the piece price to secure it.
MOQ is a cash and space commitment. The carrying cost of inventory is commonly estimated at 15–25% of unit value per year, covering capital, storage, insurance, obsolescence and handling. A part with a landed cost of $18 held for a year at 20% costs $3.60 to own, which is 20% of the unit price before any scrap.
If the MOQ forces twelve months of stock and the design life is three years, the buyer is financing the supplier's setup. That is sometimes rational — a stable part on a mature platform — and sometimes not. The decision rule: if the annual demand is less than four times the MOQ, the inventory block dominates and a higher piece price at a lower MOQ is often cheaper overall. Our sample-to-series note covers the bridge order that avoids this trap on a new part.
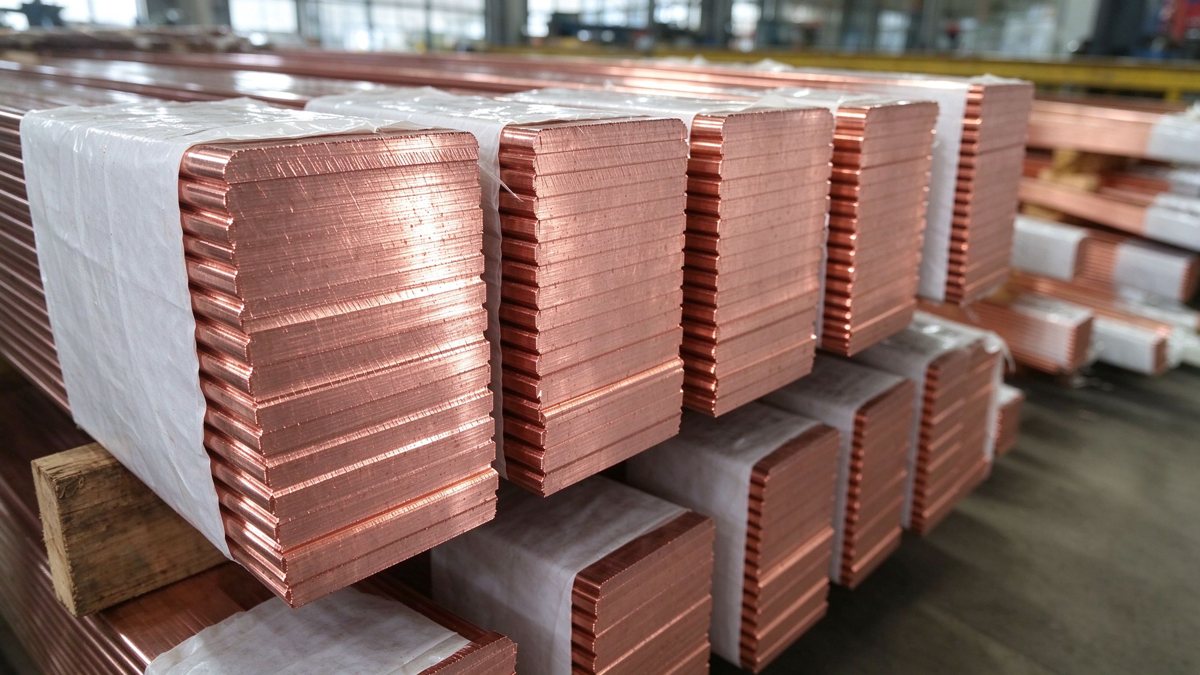
The economics are visible in a simple break-even. If the annual demand is 6,000 units and the MOQ is 10,000, the buyer holds 1.7 years of supply. At a 20% carrying rate the inventory costs about a third of a year's purchase value, and any engineering change before that stock is consumed turns it into scrap. Suppliers know this, which is why MOQ is often negotiable on a first order and less so on a repeat order.
Busbars are dense and heavy relative to value, so freight is a larger share of landed cost than for electronics. A pallet of laminated bars can weigh 600–900 kg, which puts air freight out of reach for anything but expedites. Sea freight is cheap per kilogram but adds 25–40 days of transit plus port variability; rail and road options sit between.
The comparison sheet should carry a freight per unit at the actual shipping mode and route, plus duty and insurance. A supplier quoting FOB with a 30-day ocean leg is not comparable to one quoting DDP with a 7-day road leg until both are converted to landed cost and to the working capital carried during transit. The busbar versus cable comparison is a useful sanity check on whether the assembly should be shipped as a sub-assembly instead of loose parts.
Packaging is a cost lever that buyers rarely specify. Busbars shipped loose in a crate arrive with damaged plating and require re-inspection; busbars shipped in layer-separated trays with edge protection arrive in condition and can go straight to the line. The packaging cost per unit is small, the damage cost is not. Specify the packaging in the RFQ and price it explicitly rather than accepting whatever the supplier uses.
Quality risk is the block that buyers underestimate. It includes incoming inspection time, the scrap rate at the customer line, the cost of a line stoppage, and the warranty exposure after field failure. For a busbar, the dominant risks are wrong plating thickness, laminate voids, and hole position errors that damage a module pin at assembly.
Estimate it, don't ignore it. A simple model: annual units × (internal scrap rate + line reject rate) × unit cost, plus the expected number of stoppage events per year multiplied by the cost per hour. A supplier with a 300 PPM record and a supplier with a 3,000 PPM record can look identical on piece price and differ by five figures a year on this block. Audit evidence belongs in the evaluation: the manufacturer selection guide lists what to request.
Quantify the stoppage term with the plant's own number. A line that builds 40 units an hour and stops for half a day loses 160 units of output plus the labour and the recovery time. If a supplier's history suggests one such event per year, that single term can exceed the entire annual price difference between two quotes. Procurement teams that do not have the plant's stoppage cost to hand should ask for it before the comparison is scored.
Landed cost per good unit = (piece price + freight + duty + insurance) / (1 − reject rate) + (tooling + NRE) / lifetime volume + (average inventory units × unit value × carrying rate) / annual volume.
Illustrative example, clearly not a market quote: supplier A offers $17.50 at MOQ 5,000 with $1,200 tooling; supplier B offers $16.20 at MOQ 20,000 with $1,800 tooling. Annual demand is 6,000 units. A carries 5,000 units for about 10 months on average, B carries 20,000 for about 40 months — but the program only lasts three years, so B's excess is scrapped at end of life. After carrying cost at 20% and a 1.5% end-of-life write-off, B's effective cost per good unit lands above A despite the lower piece price. Run the numbers before the negotiation, not after.
Two refinements make the model more honest. First, discount future costs: a tooling charge paid upfront is worth more than the same amount spread over three years, so apply the company's cost of capital. Second, treat the reject rate as a range rather than a point, because a supplier with no history has an unknown rate, not a zero one. Using the industry average for an unknown supplier is conservative and correct.
Build one row per offer with these columns: piece price at the buyer's annual volume; copper index date and mass; tooling and NRE; amortisation window; MOQ and resulting months of stock; lead time and transit mode; freight and duty per unit; reject rate evidence; audit status; payment terms; and total landed cost per good unit. Ten columns fit on one page and stop the comparison from collapsing into a price column.
Weight the columns by what the program actually values. A medical or rail program should weight quality risk and change control heavily. A short-life consumer program should weight inventory and lead time. The weights are a management decision, not a purchasing one, and should be agreed before quotes are opened.
Keep a second sheet for the non-price columns that carry veto power: financial stability, capacity headroom, geographic concentration, and whether the supplier can support a second production site. A quote from a supplier at 95% capacity is a delivery risk regardless of price, and that belongs in the decision record rather than in a footnote.
A four-week lead time and a twelve-week lead time differ by eight weeks of safety stock at the buyer's demand rate. For a part consumed at 500 units a month, that is roughly 1,000 units of buffer, or about $17,000 of inventory at the illustrative price above. The supplier who offers the shorter lead time at a 4% higher piece price is often the cheaper option once that buffer is priced.
Lead time also has a variance dimension. A quoted 30 days with a 20-day standard deviation is worse than a quoted 45 days with a 5-day standard deviation, because safety stock is set by the variability, not the mean. Ask for the actual distribution over the last twelve months, not the promise.
Lead time has a structure worth asking about. Part of it is queue time at the supplier, part is material procurement, part is plating and test, and part is transport. A supplier who quotes 45 days because the copper is bought per order is quoting a different model from one who holds copper stock and quotes 25 days. The second carries inventory risk and prices it in; the first passes the risk to the buyer. Neither is wrong, but the comparison should name which model is being bought.
Changing a qualified busbar supplier triggers first article, dielectric and PD requalification, a new drawing package, and often a customer notification. For a platform in production, that is a six- to sixteen-week program with engineering time attached. A 5% piece-price saving on a $500,000 annual spend is $25,000; the switching program can consume most of it in the first year.
The rule of thumb: switch when the run rate is long enough for the saving to exceed the qualification cost within twelve months, or when the current supplier's quality risk is unacceptable regardless of price. Do not switch for a saving that only materialises in year three on a platform that ends in year two.
There is also a hidden cost in not switching. A supplier who has held a part for eight years may have let the process drift, and the price may reflect a cost base that was never renegotiated. A periodic market test, even when the incumbent is retained, resets the benchmark and gives the buyer information for the next negotiation round.
Send the same package to every bidder and require the same fields: drawing with tolerance and plating callouts; annual volume plus a 3-year forecast and the expected model mix; required delivery window and acceptable transit mode; quality evidence (PPM history, audit report, PPAP or equivalent); copper index basis; tooling cost and ownership; MOQ and lead time with variance; packaging specification; payment and Incoterms; and the price break structure at 1×, 3× and 10× annual volume.
Requiring three price breaks exposes the supplier's cost structure and prevents the MOQ trap. A supplier who cannot quote below 10× annual volume is telling you the setup dominates. That is useful information, not a rejection. The RFQ evaluation guide turns the responses into a scored comparison.
Add one field that is usually missing: the change-notification requirement. A supplier who can change a plating bath, a laminate supplier or a press without telling the buyer invalidates the qualification silently. Requiring written notification before any process change, with a re-qualification trigger, is a procurement control that costs nothing to write and prevents the most common source of field failures.
The output of this exercise is not a single number. It is a defensible ranking with the assumptions visible, so that a price negotiation can target the block that is actually high. If tooling is the problem, negotiate amortisation or volume commitment. If inventory is the problem, negotiate a call-off schedule instead of a lower price. If quality risk is the problem, no price is low enough.
Run the model once per platform, then update the copper index quarterly and the carrying rate annually. It takes an afternoon and it usually pays for itself on the first order. For a second opinion on a live comparison, the sales engineering team will review the five blocks against our own cost structure.
Two live examples of the model in use: a heat pump DC link where a small part carries a large tooling share, in the inverter busbar analysis, and a bespoke geometry where the custom engineering route changes the NRE line before price is discussed.
Finally, record the decision. A one-page memo with the five blocks, the weights, the ranking and the assumptions is what makes the next audit or the next program reuse the work instead of repeating it. Procurement decisions that exist only in an email thread get re-litigated every year.
The lowest busbar quote is usually the one with the most assumptions left out. Normalise c
Read article
Buying a laminated busbar is not like buying a standard connector. The part is custom, the
Read article
Lucas Meyer advises procurement and supply-chain teams on copper sourcing, busbar pricing and supplier evaluation, with 13 years in industrial metals and electrical-component procurement. He developed SHANYUAN's copper-price quotation model and cost-breakdown framework for busbar projects. He h
Send the current profile, voltage class and terminal types — our engineers reply within one business day.